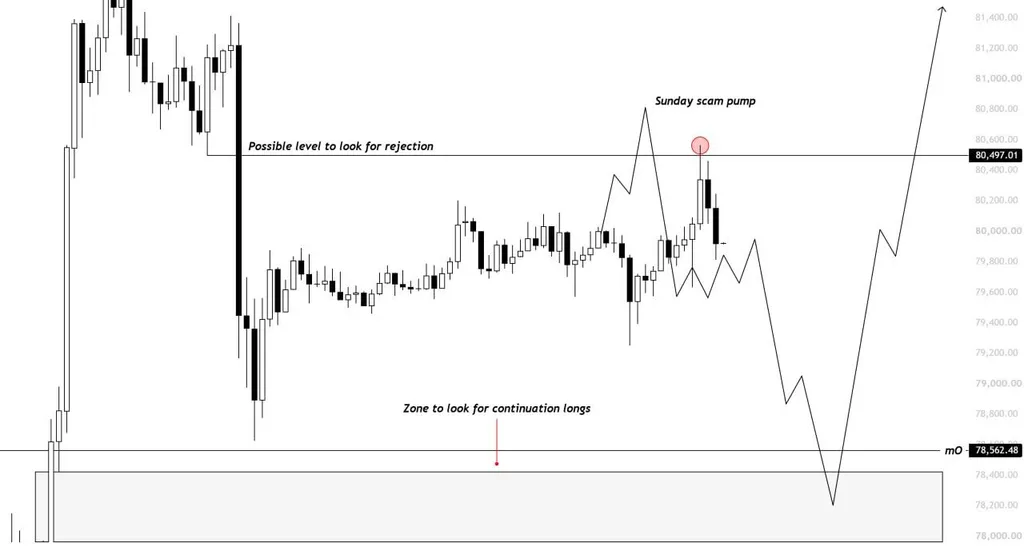
Bitcoin $BTC $80.5K Rejection and $78.5K Support. Source: Kaz (@XBTkaz) on X
The chart places the next important level near $78,562, with a broader demand zone extending from roughly $78,000 to $78,500. That area could determine whether the current decline remains a pullback within a potential recovery structure or develops into a deeper correction.
Kaz is watching the $78,500 level and the zone immediately below it for a possible long setup, with an eventual upside objective around $83,000-$84,000.
That bullish scenario needs confirmation rather than simply a touch of support. A dip toward $78,500 followed by a strong rebound would show buyers defending the area. $BTC would then need to reclaim $80,500, turning the recent rejection level into support, to strengthen the case for further upside.
A decisive break below the highlighted demand zone would weaken the setup and invalidate the immediate path projected on the chart.
Bitcoin Liquidation Heatmap Highlights $79K and $80.6K Liquidity
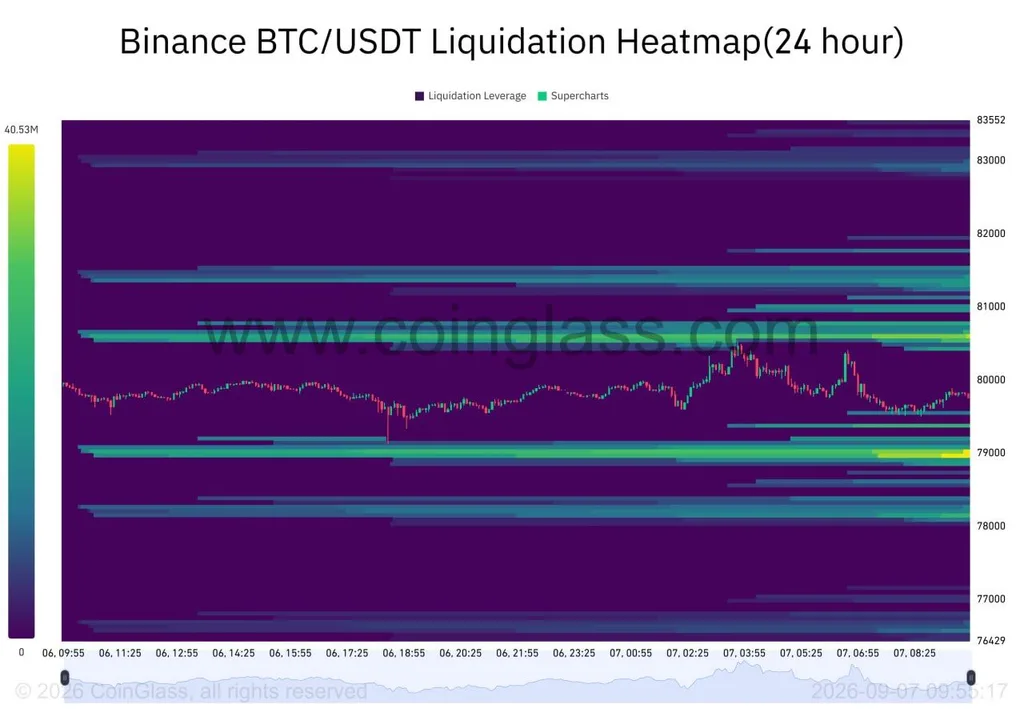
The Binance $BTC/$USDT 24-hour liquidation heatmap provides additional context for the technical setup, showing significant leveraged positioning both above and below Bitcoin’s current price.
Binance $BTC/$USDT 24-Hour Liquidation Heatmap. Source: CoinGlass
The heatmap shows one of the strongest nearby liquidity concentrations around $78,900-$79,000. Another prominent band sits around $80,600-$80,800, close to the resistance zone that recently rejected Bitcoin.
Additional liquidity is visible higher around $81,000-$81,500 and near $83,000, while another cluster sits in the low-$78,000 region.
Liquidation heatmaps identify price areas where leveraged positions could be forced to close. These concentrations can attract attention because reaching them may accelerate volatility, but they are not guaranteed price targets.
With Bitcoin trading at about $79,829 at the time of writing, according to CoinMarketCap, $BTC remains positioned between the major nearby liquidity pools.
That creates a relatively clear short-term battle. A move below $79,000 could expose the $78,500 support area and potentially the lower demand zone. Conversely, a recovery above $80,500-$80,800 could force attention toward liquidity around $81,000 and higher.
Bitcoin Price Prediction: Can $BTC Reach $83,000?
The immediate Bitcoin price outlook depends heavily on the reaction around $78,500-$79,000.
If buyers defend that region and $BTC subsequently reclaims $80,500, the technical structure would improve and the $83,000-$84,000 target could come back into play. If $78,500 fails decisively, however, the bullish continuation setup would lose strength and Bitcoin could spend more time searching for support below the current range.

 coinpaper.com