Is Bitcoin About to Flash Crash? What a 'Bart Simpson' Pattern Would Actually Take
decrypt.co
02 September 2026 20:30, UTC
In brief
Bitcoin is consolidating near $77,500 after spiking from roughly $64,420 to nearly $80,700 in six trading days last week, the move traders are calling a "Bart Simpson" setup.
The four-hour chart's own indicators show a stalling market, not the violent breakdown a completed Bart Simpson pattern requires.
Analysts have flagged $75,800 as the level that would confirm the bearish setup; a slower, weeks-long slide toward $62,000 along a descending trendline is the more realistic alternative to an actual flash crash.
Bitcoin gained close to 25% in August, ripping from about $64,420 on August 19 to nearly $80,700 by August 25. It has spent the week since grinding sideways and fading, last trading around $77,470.
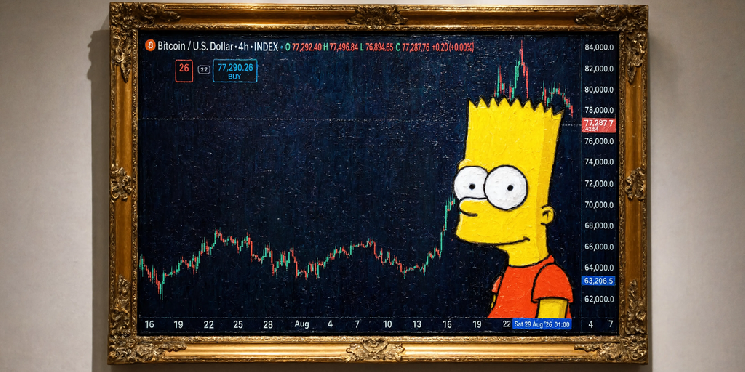
That shape—sharp spike, flat top, partial giveback—is why crypto traders keep typing the words "Bart Simpson" into their group chats.
Know when your coins move
Alerts, real-time prices, and market news — all in one app
4.8 based on 40K reviews in the App Store and Google Play
pic.twitter.com/aFXhmo6HbU
— Benjamin Cowen (@benjamincowen) September 1, 2026
The Bart Simpson pattern is a chart-formation nickname, not a technical indicator. It describes a sharp move in one direction, a period of tight sideways chop, then a snap back toward where the move started—resembling the cartoon character's spiked hair. It has circulated in crypto trading circles since 2015 and tends to resurface every time Bitcoin pulls off a fast, narrow-range rally like August's.
What the 4-hour chart actually shows
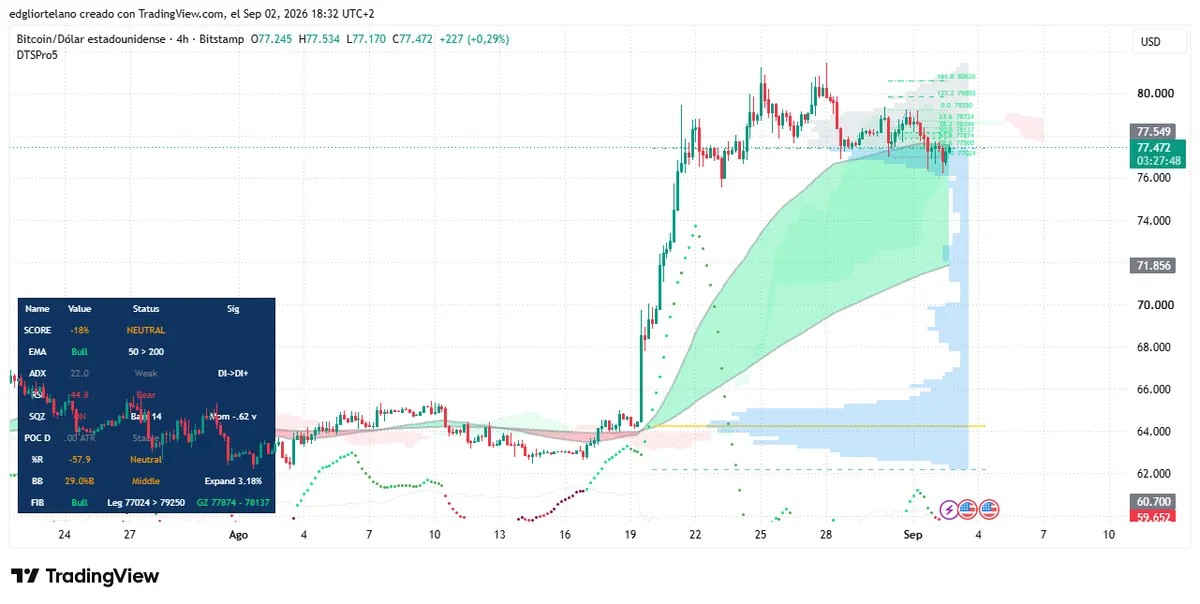
The Bart pattern would imply Bitcoin is in store for a flash crash, but Bitcoin's four-hour chart reads mixed, not alarming signals. The Relative Strength Index, or RSI, measures how overbought or oversold an asset is on a 0-100 scale, and for BTC it currently sits at 44.8—leaning bearish but nowhere near the sub-30 oversold territory that typically accompanies a real breakdown.
The Average Directional Index, or ADX, gauges how strong a trend is regardless of direction, and that’s at 22, below the 25 threshold traders use to confirm a market is actually trending in either direction.
Bitcoin price data. Image: Tradingview
The most alarming data point is the Squeeze Momentum indicator, which flags when volatility is compressing before an eventual breakout. For Bitcoin, that’s currently signaling bearish, and with momentum falling. Right now it is showing a compression zone, meaning there may be a big movement ahead. If the jump is bearish, the Bart Simpson would happen, and if it’s to the upside, the bullish trend is confirmed.
The 50-period exponential moving average is still above the 200-period moving average, the textbook definition of a bullish trend structure, even as short-term momentum cools. This setup usually means a Bart Simpson is unlikely, because prices are bullish on average.
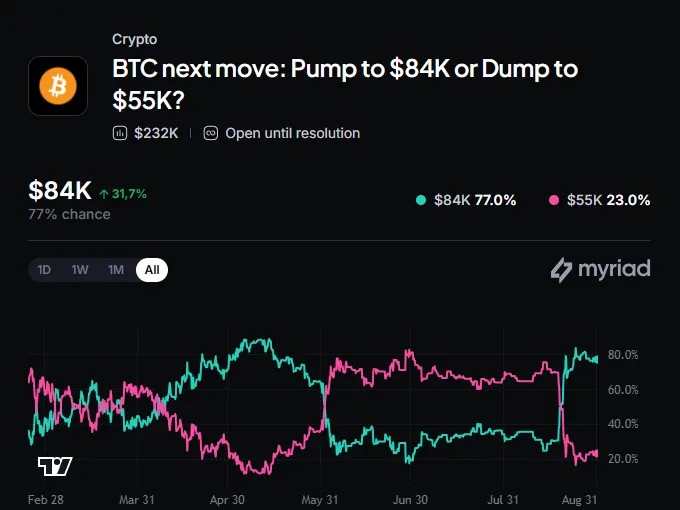
Myriad: Bitcoin price next move? Click to make your prediction.
None of these readings individually scream imminent crash, which is part of why analysts are split on whether the Bart Simpson pattern actually completely forms this time.
What a real flash crash would require
A completed Bart Simpson needs the reversal to happen roughly as fast as the spike did—that's the entire premise of the pattern.
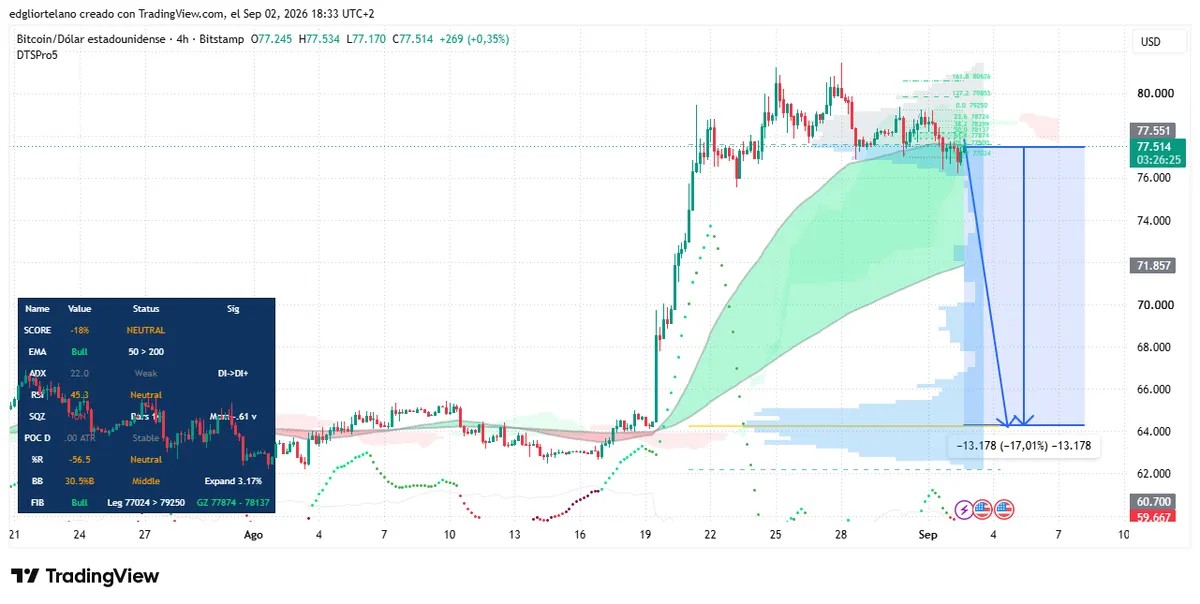
Applied to Bitcoin's current setup, a genuine flash-crash version would mean price giving back the whole August rally in a matter of hours, not weeks, snapping back down toward the $64,000 zone it launched from. That's close to a 17% single move, on par with the scale of the rally itself.
Bitcoin price data. Image: Tradingview
Getting there isn't a matter of drifting lower. It requires a specific trigger: a break below $75,800. Holding above it would tend to invalidate the bearish setup instead.
A flash crash also needs a catalyst violent enough to force it: cascading leveraged liquidations, not a routine pullback. Bitcoin has produced exactly that kind of event before, including the $19 billion liquidation wipeout triggered by an October 2025 Trump tariff threat, so the mechanism exists. It just hasn't shown up yet in this week's four-hour indicators, which is why the pattern remains a possibility traders are debating rather than something already confirmed.
Why September is amplifying the chatter
The Bart Simpson talk is landing during Bitcoin's historically weakest month. Bitcoin has closed eight of the last 13 Septembers in the red since 2013, averaging a 2.97% loss. This is the worst average and median of any month on the calendar. Traders have nicknamed it "Red September," and this year it's colliding with a live Federal Reserve decision.
The CME FedWatch tool currently prices a 64% chance the Fed hikes rates at its September 15-16 meeting. That’s typically bearish for risk assets, including crypto, because as lending gets more expensive, investors look for safe assets like gold/bonds to hedge against losses. Spot Bitcoin ETFs shed roughly $236 million on Tuesday alone, and oil has climbed into the low $90s a barrel after fresh U.S.-Iran strikes near the Strait of Hormuz, adding inflation pressure to the case for a hike.
None of that guarantees a crash on its own, but they are worth considering before opening trades. A rate-driven risk-off move and a Bart Simpson flash crash are two different mechanisms that happen to point in the same direction right now.
The other scenario: A correction that isn't a flash crash
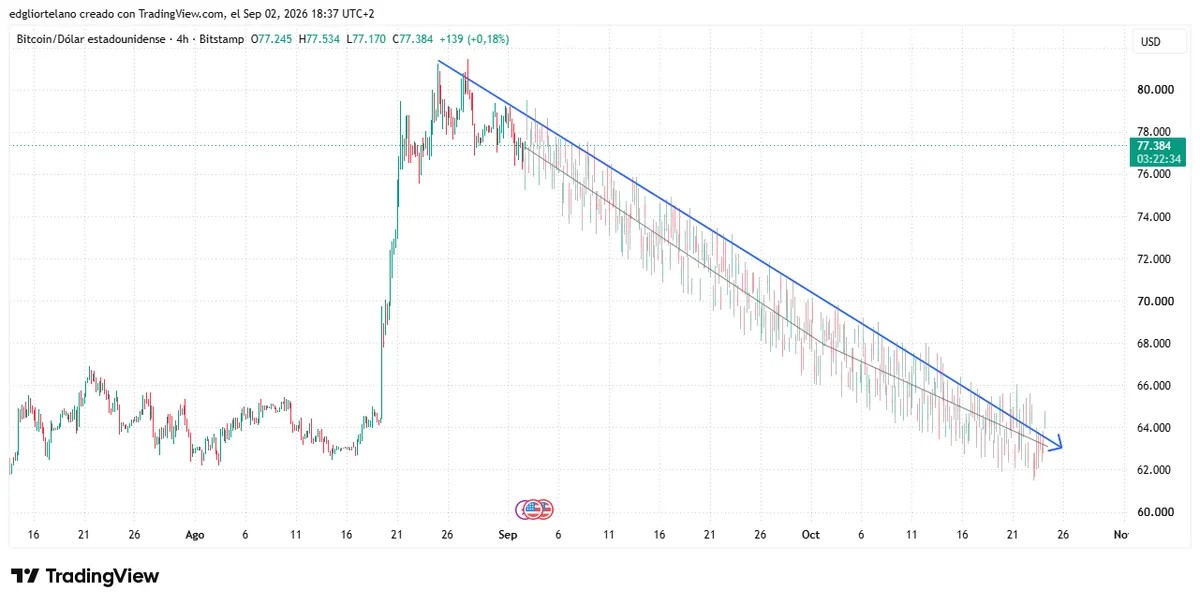
There's a second bearish path that looks nothing like Bart Simpson. Drawing a descending trendline from the roughly $80,626 August high based on supports, the current indicators and natural expectations produces a gradual downward channel that reaches the $62,000 area over about eight weeks, into late October, rather than in a single violent leg
Bitcoin price data. Image: Tradingview
That's a similar percentage decline to the flash-crash scenario, but stretched across a seasonally weak September and a historically volatile October instead of compressed into hours.
This is also the pattern Bitcoin has actually drawn before. Decrypt reported in March that Bitcoin's price action was tracing a compressive wedge—a series of lower highs against a descending resistance line—that preceded crashes in October 2025 and January 2026. Both of those were grinding structural breakdowns, not one-candle flash crashes. A slow bleed with lower highs and lower lows is still bearish, but it's mechanically a correction, not a Bart Simpson.
The distinction matters for anyone trying to trade around the meme. A flash crash needs a forced-liquidation event and a fast break of $75,800 to complete the pattern's shape. A drawn-out correction just needs September's seasonal drag, a Fed hike, and time.
Disclaimer
The views and opinions expressed by the author are for informational purposes only and do not constitute financial, investment, or other advice.

 decrypt.co