
 coinpaper.com

Bitcoin is trading near $77,600 after pulling back from above $80,000, leaving traders with a sharp divide between short-term weakness and a still-constructive longer-term structure. A four-hour chart points to increased risk of a drop toward $74,000, while a separate macro setup argues that holding the broader breakout zone could eventually restart Bitcoin’s expansion toward six figures.
Bitcoin Lower High Raises Risk of a $74K Support Test
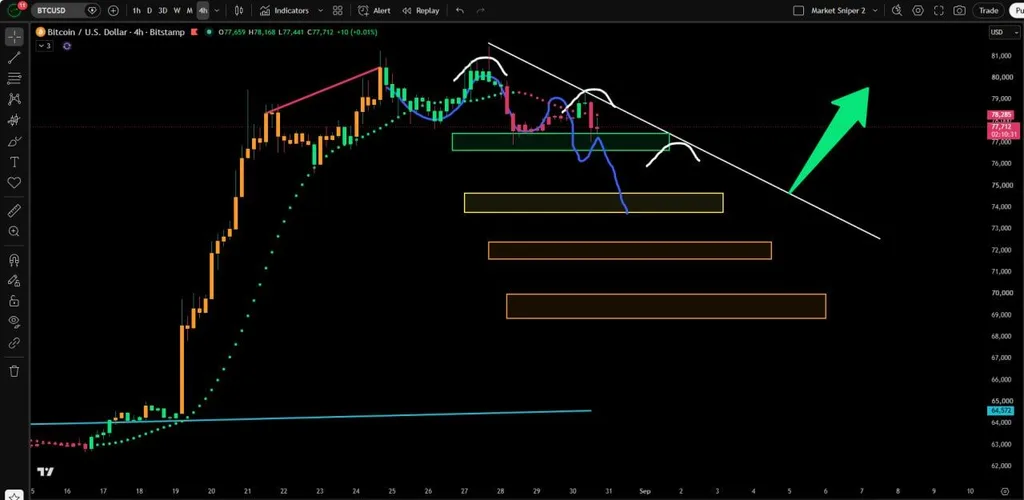
Bitcoin’s four-hour structure has weakened after price formed a lower high beneath a descending trendline, putting immediate support around $77,000 under pressure.
Bitcoin $BTC $74K Support Retest. Source: Jesse Olson on X
The chart places $BTC near $77,700 after its recent rally stalled around the $80,000-$81,000 area. Instead of extending the advance, price turned lower and printed a lower high, an early sign that buyers have lost some short-term momentum.
The first battleground is the green support zone around $76,500-$77,500. Olson noted that this initial target has already been retested and argued that the reaction increases the probability of price eventually reaching the yellow demand area below.
That yellow zone sits around $74,000-$74,500 and is the clearest downside target on the chart. A decisive loss of current support would strengthen the bearish scenario and expose that area.
Further weakness could bring the lower orange zones near $72,000 and roughly $69,000-$70,000 into consideration, though the chart does not require $BTC to reach them. They become relevant only if sellers continue to control the structure after a break below $74,000.
The bearish setup also has a clear invalidation path. Bitcoin would need to defend support, recover toward $79,000 and break the descending trendline that has capped successive highs. Until then, rallies beneath that line remain vulnerable to renewed selling.
Fresh market data supports the importance of the immediate range. Bitcoin was holding near $77,580 during Asian trading Monday, with market observers identifying roughly $77,000 as immediate support and $79,400-$80,800 as key resistance.
Long-Term Bitcoin Structure Still Points to Expansion if Support Holds
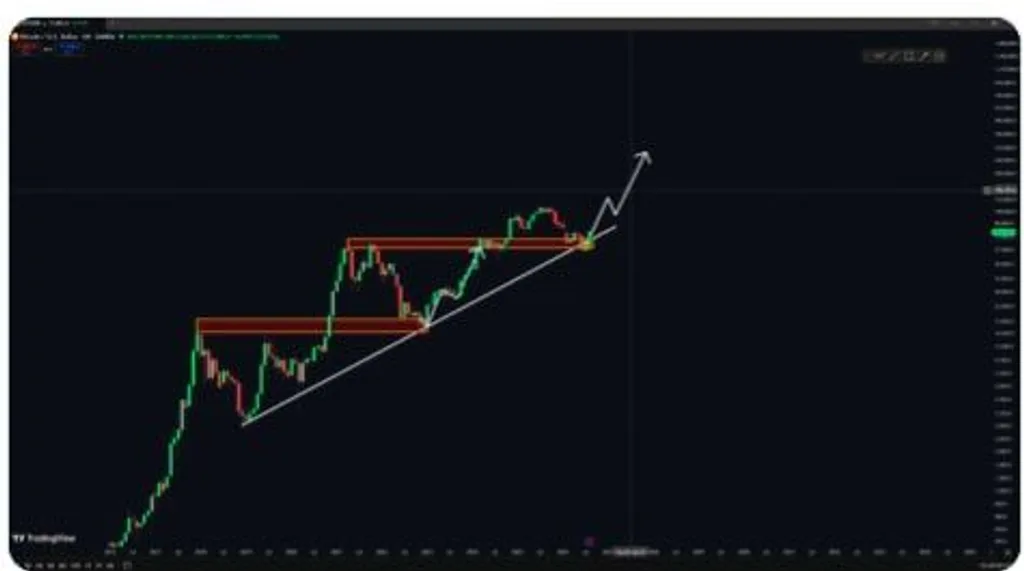
Marzell’s chart shifts the timeframe dramatically, comparing Bitcoin’s current position with earlier cycles in which major breakouts were followed by consolidation, a support retest and another expansion.
Bitcoin $BTC Macro Breakout Retest. Source: Alex Marzell on X
Marzell’s chart highlights repeated instances where former resistance became support while a rising long-term trendline remained intact. The current setup is presented as another potential version of that breakout-consolidation-retest sequence.
That interpretation creates an important distinction from the four-hour bearish signal: a near-term decline would not automatically invalidate the larger bullish thesis.
The macro case depends on $BTC holding its major breakout region and rising trend support. If buyers continue defending that structure, the chart projects another expansion phase, with $100,000 as the first major psychological objective before potential extensions toward $140,000 and, in a much more aggressive scenario, $200,000.
Those higher levels should be treated as conditional roadmap targets, not confirmed forecasts. Bitcoin must first prove that the current retest is constructive rather than the beginning of a deeper breakdown.
The broader backdrop has improved substantially during August. Bitcoin has gained about 23% this month even after retreating from last week’s highs, outperforming several major traditional assets during the period.
For the immediate Bitcoin price prediction, however, $77,000 and $74,000 matter more than distant six-figure targets. Holding those areas and later reclaiming $79,400-$80,800 would weaken the short-term bearish case; losing them would favor a deeper correction before the macro bullish structure gets its next test.