
 coindesk.com
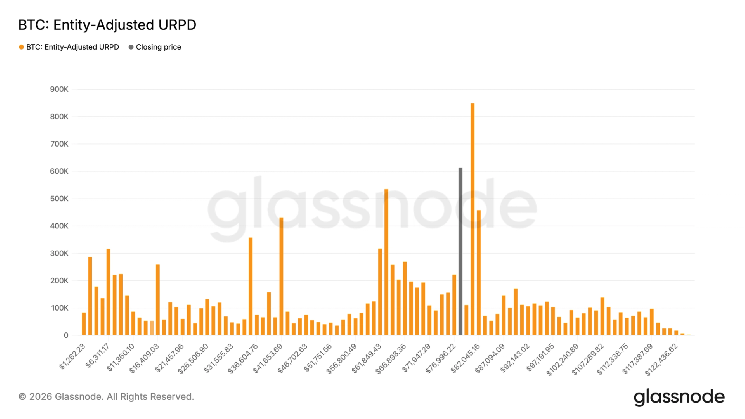
Bitcoin faces a significant resistance wall between $80,000 and $82,000, the largest concentration of supply across any comparable price range.
According to Glassnode’s Realized Price Distribution (URPD), nearly 8% of bitcoin’s supply was acquired within this band. The metric shows where the existing supply last moved, assigning each entity’s total balance to its average purchase-price bucket.
Around 5% of bitcoin’s supply is concentrated at $80,000, the largest cluster at any individual price level, while $82,000 represents the fourth largest. The $78,000 level contains the second-largest cluster, accounting for approximately 3.7% of supply.
These concentrations matter because investors who acquired bitcoin around these levels may sell as the price returns to their cost basis, creating overhead resistance.
While, the average cost basis of deposits into the U.S. bitcoin spot ETFs is also around $80,000 to $82,000 adding to the potential sell-pressure.

A similar dynamic developed between $60,000 and $63,000, where more than 6% of supply is concentrated. That area became a strong support zone after bitcoin traded within the range for much of 2026 and only briefly fell below $60,000 during the summer but reclaimed that price level quickly.
The 50-week moving average, which tracks bitcoin’s average closing price over the previous 50 weeks, currently sits at $81,081. Bitcoin has remained below it since November 2025. The previous two major recoveries above this trend line, in May 2020 and March 2023, were followed by sustained bull runs.