
 cryptoticker.io
Bitcoin finally punched through 80,000 dollars. The daily candle on Bitstamp opened at 78,985 dollars, ran up to 81,255 dollars, and then handed most of that back, settling near 79,121 dollars for a gain of only 0.17 percent on the session. It was the first time Bitcoin traded above 80,000 since May, and the seven-day advance now sits at roughly 25 percent.
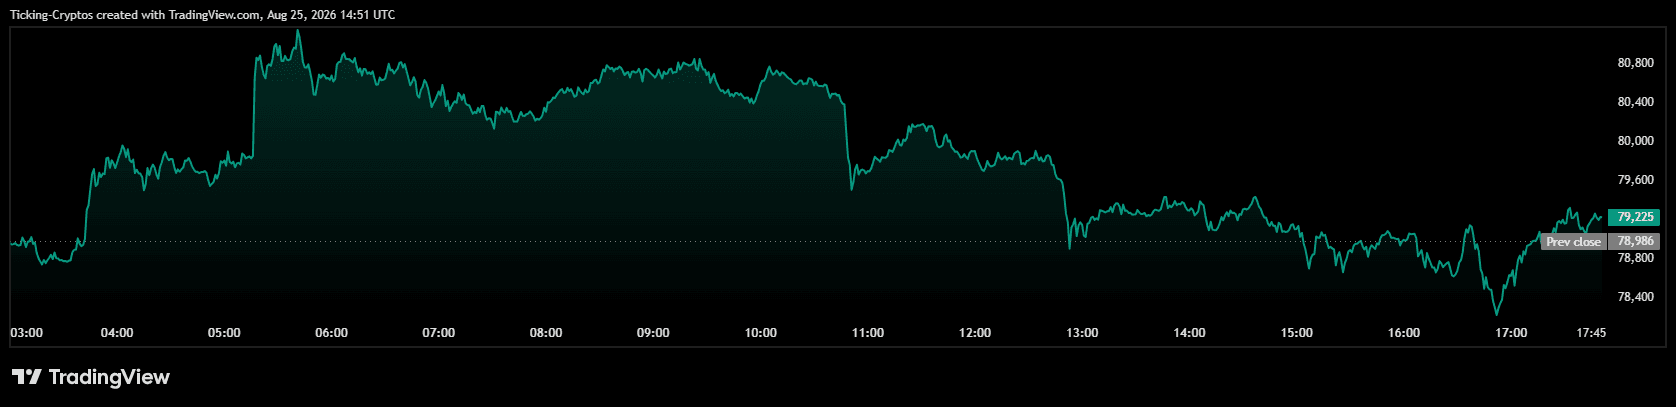
The pullback is not a failure. It is what a market does when it sprints 25 percent in a week and arrives at a resistance band that already rejected it once this year. What matters now is whether buyers can defend the low 79,000s and turn 78,670 dollars into a floor instead of a ceiling.
Altcoins, meanwhile, have not blinked. $Solana is up more than 6 percent on the day, $Ethereum is holding above 2,490 dollars, and $XRP has posted its strongest week since November 2024. The rotation is starting, but the Altcoin Season Index still sits well below the level that would confirm a full altseason.
Why did Bitcoin fall back after touching 81,255 dollars?
Bitcoin ran straight into the same supply zone that capped the market in early May, and profit taking did the rest.
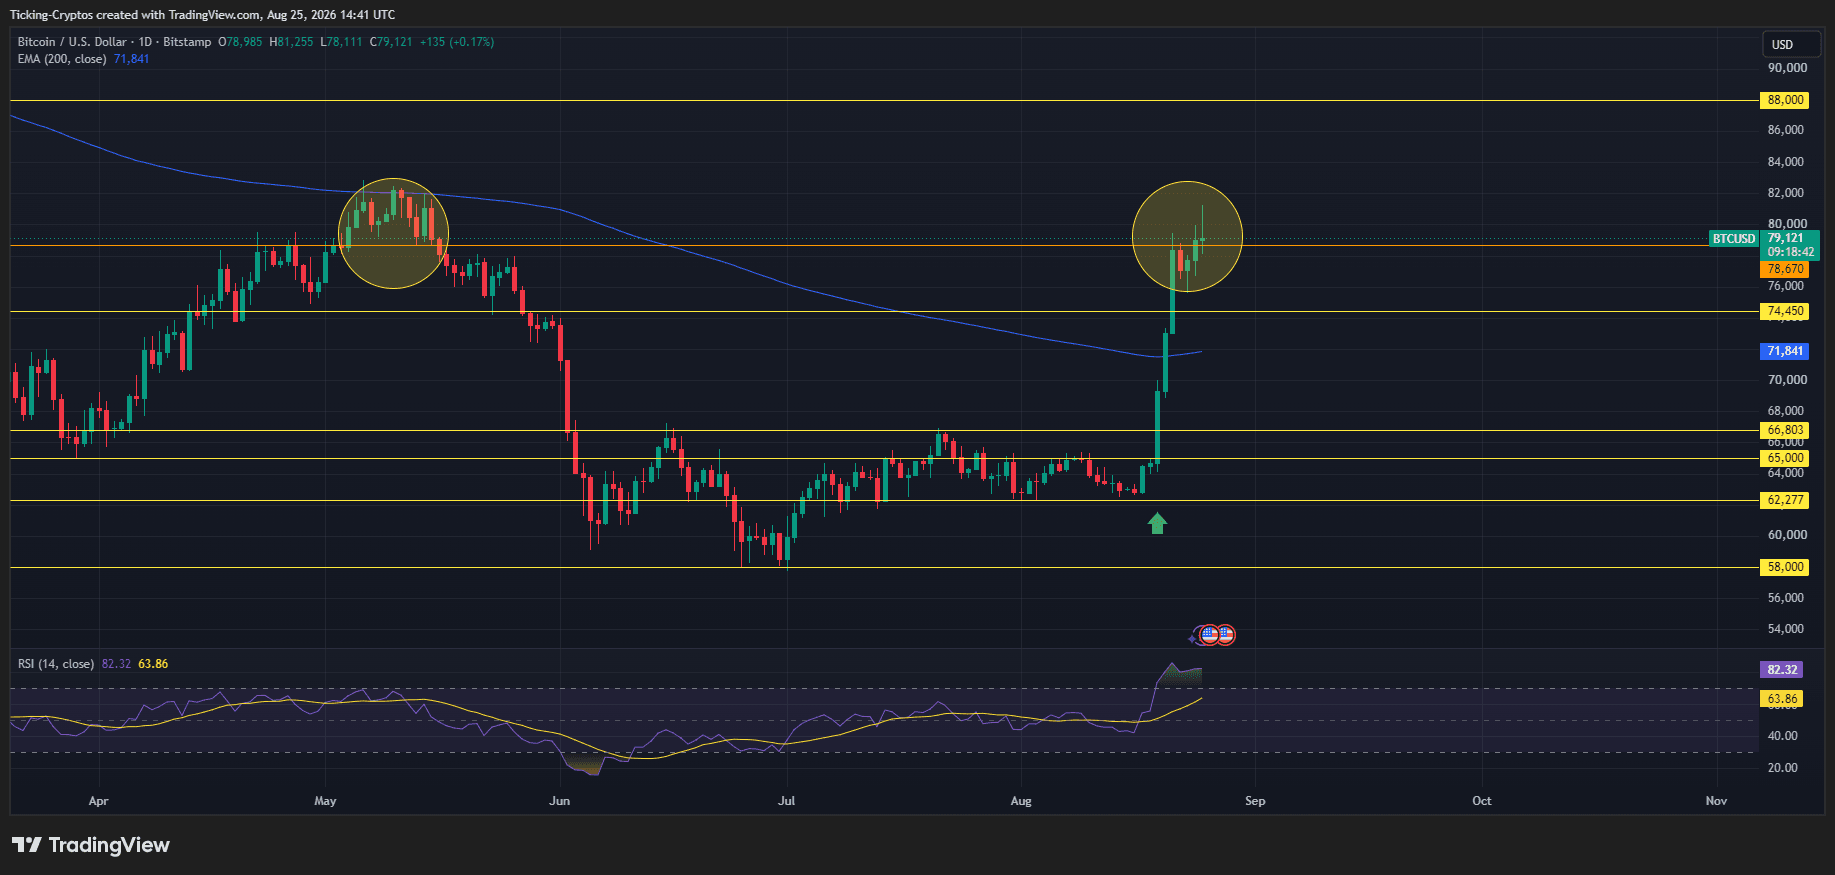
Look at the two circles on the daily chart. The first marks the early May topping cluster in the 80,000 to 82,000 area. The second marks this week's spike into exactly the same band. That is not coincidence, it is memory. Traders who bought that region in May and sat through a drop to 58,000 dollars are getting their first chance to exit flat, and that supply has to be absorbed before price can go higher.
The mechanics behind the move also invited a fade. A wave of short liquidations exceeding 220 million dollars in 24 hours accelerated the final leg into 80,000. Liquidation-driven candles tend to overshoot, and once the forced buying stops, price drifts back toward the level where real bids sit.
The underlying bid is still there. US spot Bitcoin ETFs pulled in roughly 1.9 billion dollars in net inflows for the week ending 21 August, the strongest weekly intake since October 2025, with BlackRock's iShares Bitcoin Trust taking the largest share. That is spot demand, not leverage.
What does the 200 EMA reclaim tell us?
$Bitcoin has flipped its 200-day EMA from resistance to potential support for the first time since May, which is the single most constructive part of this chart.
The blue 200-day EMA sits at 71,841 dollars. For nearly three months it capped every rally attempt. On the breakout candle from the 62,277 area, price sliced through it in a single session and has not looked back.
That changes the structure. As long as daily closes hold above 71,841 dollars, the medium-term trend argument belongs to the bulls. A daily close back below it would tell you the breakout was a liquidity event rather than a trend change.
Positioning supports the constructive read. Coin-denominated open interest actually fell around 11 percent during the rally, from roughly 353,500 $BTC to 312,600 $BTC, while price gained more than 20 percent. A rally that reduces leverage instead of piling it on is a healthier rally.

Which upside targets matter if Bitcoin clears 81,255 dollars?
The first real test is a daily close above 82,000 dollars, and the measured target beyond that is 88,000 dollars.
Here is the upside ladder from the chart:
- 81,255 dollars: the immediate high. A reclaim on strong volume puts the May cluster back in play.
- 82,000 to 82,500 dollars: the top of the May rejection zone. This is the true breakout line, not the round 80,000 number.
- 85,000 dollars: psychological midpoint, likely a pause zone rather than a wall.
- 88,000 dollars: the marked yellow resistance and the logical destination if the May supply clears.
Options markets are already leaning that way. The 25-delta call skew has fallen to its lowest level of the year across the curve and has flipped negative at the front end, meaning traders are paying up for upside exposure rather than downside protection.
Where is Bitcoin's next support if the pullback deepens?
78,670 dollars is the line in the sand for the short term, with 74,450 and the 200 EMA at 71,841 dollars below it.
The downside ladder:
- 78,670 dollars: immediate support, essentially where price is trading now. Losing it opens the gap below.
- 74,450 dollars: the first meaningful shelf. This is the most likely destination for a routine retracement after a 25 percent week.
- 71,841 dollars: the 200-day EMA. A retest here would be textbook and still bullish, since the breakout candle originated below it.
- 66,803 and 65,000 dollars: the top of the July and August consolidation range. A drop here means the breakout has failed.
- 62,277 dollars: the launch pad marked by the green arrow. Full invalidation.
Note the air pocket between 78,670 and 74,450 dollars. There is very little traded structure in that band because price crossed it in a single vertical candle, which means any move lower can be fast.
Are altcoins actually outperforming Bitcoin right now?
Selected altcoins are outperforming, but the broader market has not yet flipped into altseason.
Solana leads the daily board with a gain above 6 percent, helped by a five-day inflow streak into Solana ETFs that pushed cumulative net inflows to a record 1.22 billion dollars. $XRP has posted roughly 50 percent on the week, its best stretch since November 2024. Ethereum is more measured, holding around 2,490 dollars.
The caveat is that the Altcoin Season Index is nowhere near the threshold that would confirm a genuine rotation. Capital is still concentrating in the largest names with ETF access rather than spreading down the market cap curve. If Bitcoin consolidates sideways from here, that is when the rotation typically broadens. If Bitcoin corrects hard, altcoins usually fall further and faster.