Bitcoin Long-Term Price Scenarios. Source: More Crypto Online (@Morecryptoonl) on X
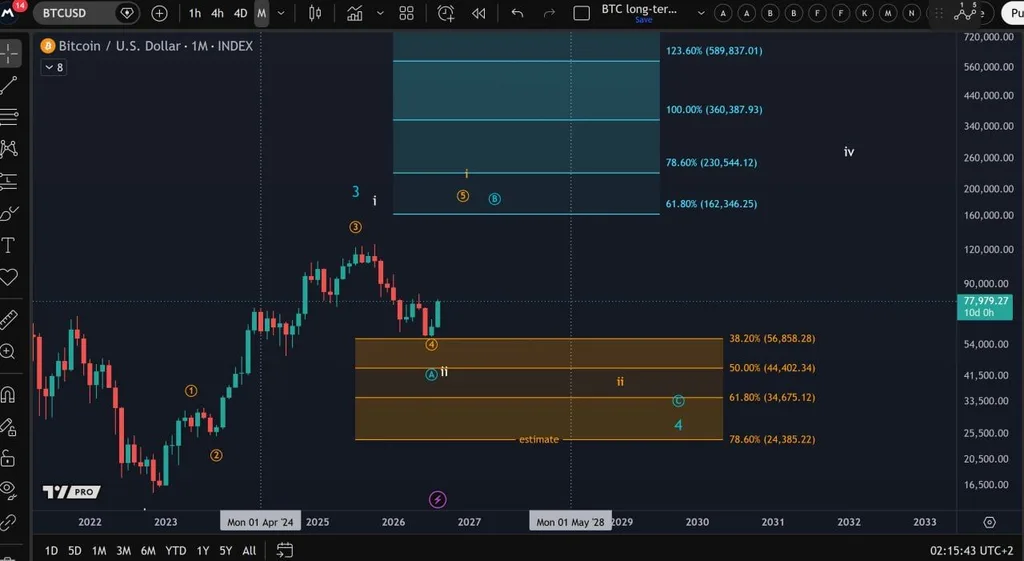
The long-term structure shows Bitcoin recovering after a pullback from its previous peak, leaving the market at an important point in the larger Elliott Wave count. According to the analyst, a further advance from current levels would favor the orange and blue scenarios marked on the chart.
The first major upside reference sits near the 61.8% Fibonacci extension at roughly $162,346. Above that, the chart identifies additional levels around $230,544 at 78.6%, $360,388 at 100% and $589,837 at 123.6%. These are long-range technical projections rather than immediate price targets, and Bitcoin would need to establish a sustained higher trend before the upper levels become relevant.
The chart also keeps a substantial corrective scenario in view. Its lower Fibonacci zone begins near $56,858 at the 38.2% level, followed by approximately $44,402 at 50%, $34,675 at 61.8% and $24,385 at 78.6%. Those levels outline potential support areas if the broader structure develops into a deeper correction instead of extending directly higher.
For now, the chart makes continued upside the key confirmation signal. A sustained move higher would strengthen the orange and blue long-term counts, while renewed weakness toward the lower retracement zone would shift attention back to the corrective structure. The practical takeaway is that the long-term bullish scenarios remain possible, but they depend on Bitcoin extending its recovery rather than rolling back toward the major Fibonacci support levels.
Bitcoin Bearish Divergence Puts $76,000 Support in Focus
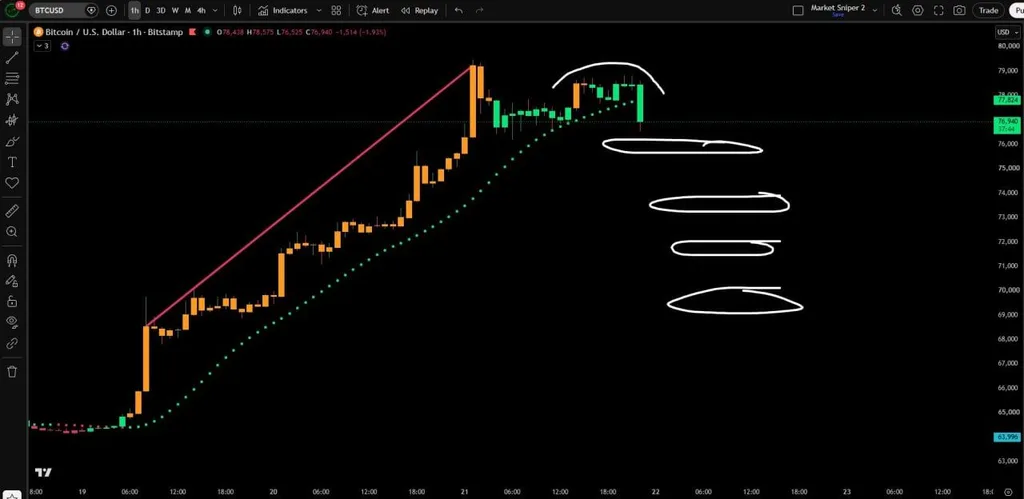
Bitcoin and altcoins face a possible short-term pullback after bearish divergence appeared on Bitcoin’s one-hour chart, according to analyst Jesse Olson. $BTC retreated from nearly $79,000 to about $76,940 as momentum weakened.
Bitcoin One-Hour Bearish Divergence Chart. Source name: Jesse Olson (@JesseOlson) on X
Bitcoin rallied from roughly $64,000 to above $79,000 before stalling below its recent peak. The chart shows a rounded top followed by a 1.9% hourly decline, suggesting buyers may be losing control.
Initial support sits near $76,000. A decisive break could expose the approximate $73,500, $72,000 and $69,500 support zones highlighted on the chart. Bitcoin weakness could also increase selling pressure across more volatile altcoins.
The bearish setup would weaken if Bitcoin reclaims $78,000 and breaks above $79,000. Until then, losing $76,000 would provide stronger confirmation of a broader correction.

 coinpaper.com