BTC Price Hits 200-Day EMA as $3.3B Liquidations Fuel Rally
coinpedia.org
20 August 2026 20:02, UTC
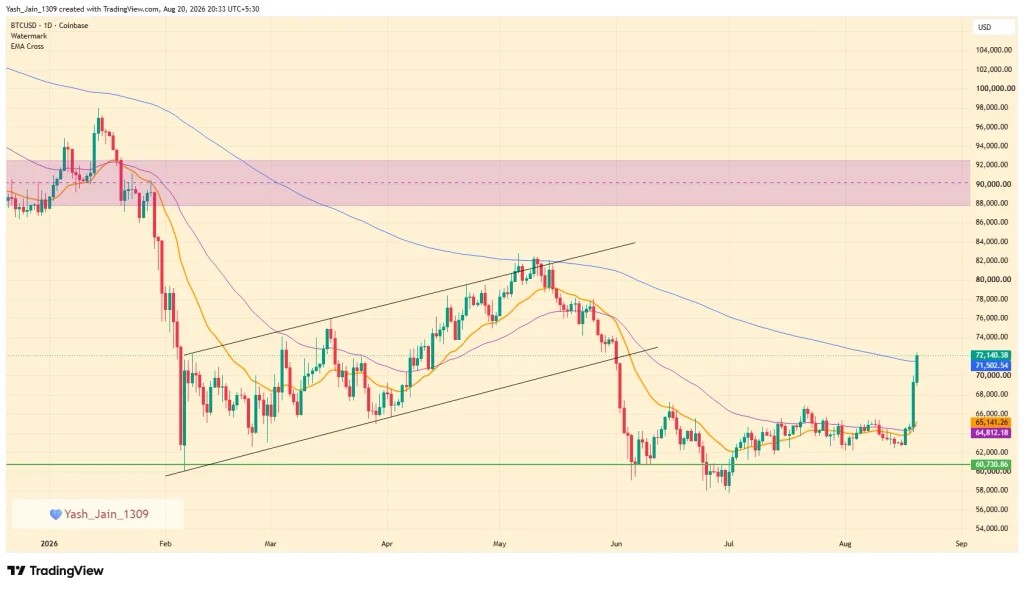
The $BTC price has run hard enough to wake up an altcoin market that had little to celebrate. From $62,821 on August 17 to $72,071 by August 20, Bitcoin gained roughly 14%, pushing against its 200-day EMA while the top 100 altcoins largely moved into the green.
$BTC Price Rally Gives Altcoins Room to Breathe
This wasn’t simply a Bitcoin move. The rally has spread across the broader market, with major altcoins responding positively as traders regain some appetite for risk. Still, the biggest driver appears to have come from the derivatives market, where short sellers were caught leaning too heavily toward another leg lower.
Know when your coins move
Alerts, real-time prices, and market news — all in one app
Point your phone camera to install
4.8 based on 40K reviews in the App Store and Google Play
The result was a sizeable short squeeze. As the $BTC price climbed from August 17 onward, leveraged bearish positions were liquidated across the market. CoinGlass data shows total crypto liquidations reaching $3.30 billion over the latest 24-hour period.
That matters because leverage can turn an ordinary price move into something considerably more violent. Once positions begin getting liquidated, forced buying can push prices higher, creating another round of liquidations. It’s an ugly feedback loop for anyone positioned on the wrong side.
Washington Moves Help Shift Market Expectations
The timing also coincides with a more supportive regulatory backdrop. On August 19, President Trump hosted crypto executives at the White House and pushed Congress to accelerate passage of the CLARITY Act. The proposed legislation is proposed to offer clearer crypto jurisdiction, potentially creating a more defined framework for institutional participation.
A day earlier, the SEC’s “Regulation Crypto Assets” proposal also emerged, with a 402-page proposed rulemaking framework aimed at establishing federal offering pathways. Together, these developments have reduced some of the regulatory uncertainty cited as a barrier to institutional compliance.
That doesn’t automatically make the market bullish for long-term. But apparently, traders didn’t need much convincing once shorts started getting squeezed.
$BTC Price Faces Technical Test After Sharp Recovery
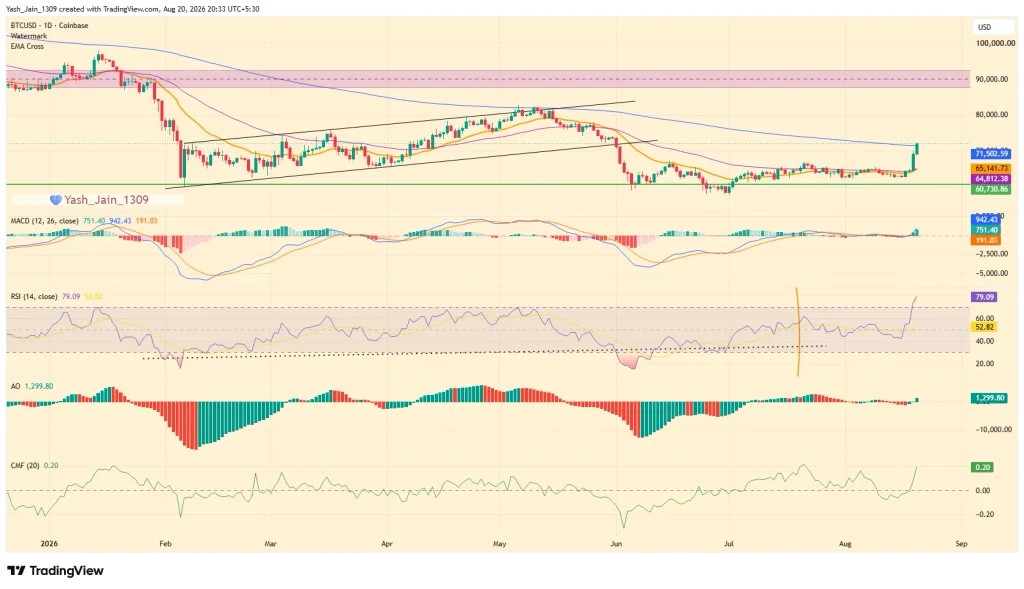
The technical picture has improved, too. MACD is showing a widening gap between its line and signal line, while the AO histogram has turned green. Both point toward improving momentum.
But there’s a catch and that is RSI which is sitting at 79.41, firmly in overheated territory, suggesting the rally may need a breather. CMF is also at 0.20, a level that has acted as a turning point for the price since January 2026, according to the provided data.
Also another uncomfortable part is the 200-day EMA. A rejection could send the $BTC price back toward $60,730, repeating the pattern seen in May when Bitcoin price fell from $81,143 to that level after encountering resistance around the same indicator.
If buyers instead reclaim the 200-day EMA and hold above it, the next major upside objective comes around $90,000. For the $BTC price, that’s the clean bullish scenario. First, though, it has to prove that this rally can survive its most important resistance test.

 coinpedia.org