
 coindesk.com
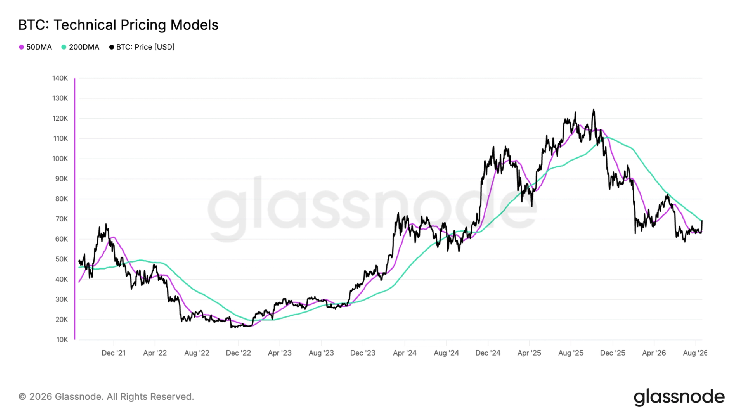
Bitcoin BTC$71,936.32 may be moving closer to forming a “golden cross”, a technical pattern commonly interpreted as a bullish long-term momentum signal. The pattern would emerge if bitcoin’s 50-day simple moving average (SMA), currently at $63,976, continues to rise and crosses above its 200-day SMA, currently at $69,005.
The potential crossover comes as bitcoin trades above $71,000, having gained more than 12% over the past week. The price is also slightly above its 200-day SMA.
The 200-day SMA tracks bitcoin’s average closing price over the previous 200 days and is widely used to gauge the market’s long-term trend. A sustained move above it can signal a shift from a bear market to a bull market, while a move below it can indicate the reverse.
Bitcoin had traded below its 200-day SMA since October 2025, when its price was roughly $110,000, indicating its long-term downtrend.
The price typically rises before the crossover occurs, meaning traders who waited for confirmation may have missed part of the move. Golden crosses have occurred in February 2023, October 2023, October 2024 and April 2025, all of which preceded further rallies in bitcoin’s price.
However, this could still be a relief rally rather than the beginning of a sustained uptrend. A decisive move back below the 200-day SMA could invalidate the case that bitcoin’s longer-term trend has turned bullish.



