During the bear markets of 2014–2015, 2018–2019, and 2022, the indicator remained below breakeven for prolonged periods. However, a market bottom is not necessarily indicated by falling below 1. In fact, past cycles indicate that before Bitcoin establishes a long-lasting recovery, the 365-day ROI may stay low for months and decline significantly further. Because of this, the current reading is less helpful as a direct buy signal and more helpful as a description of the market regime.
Will Bitcoin stabilize?
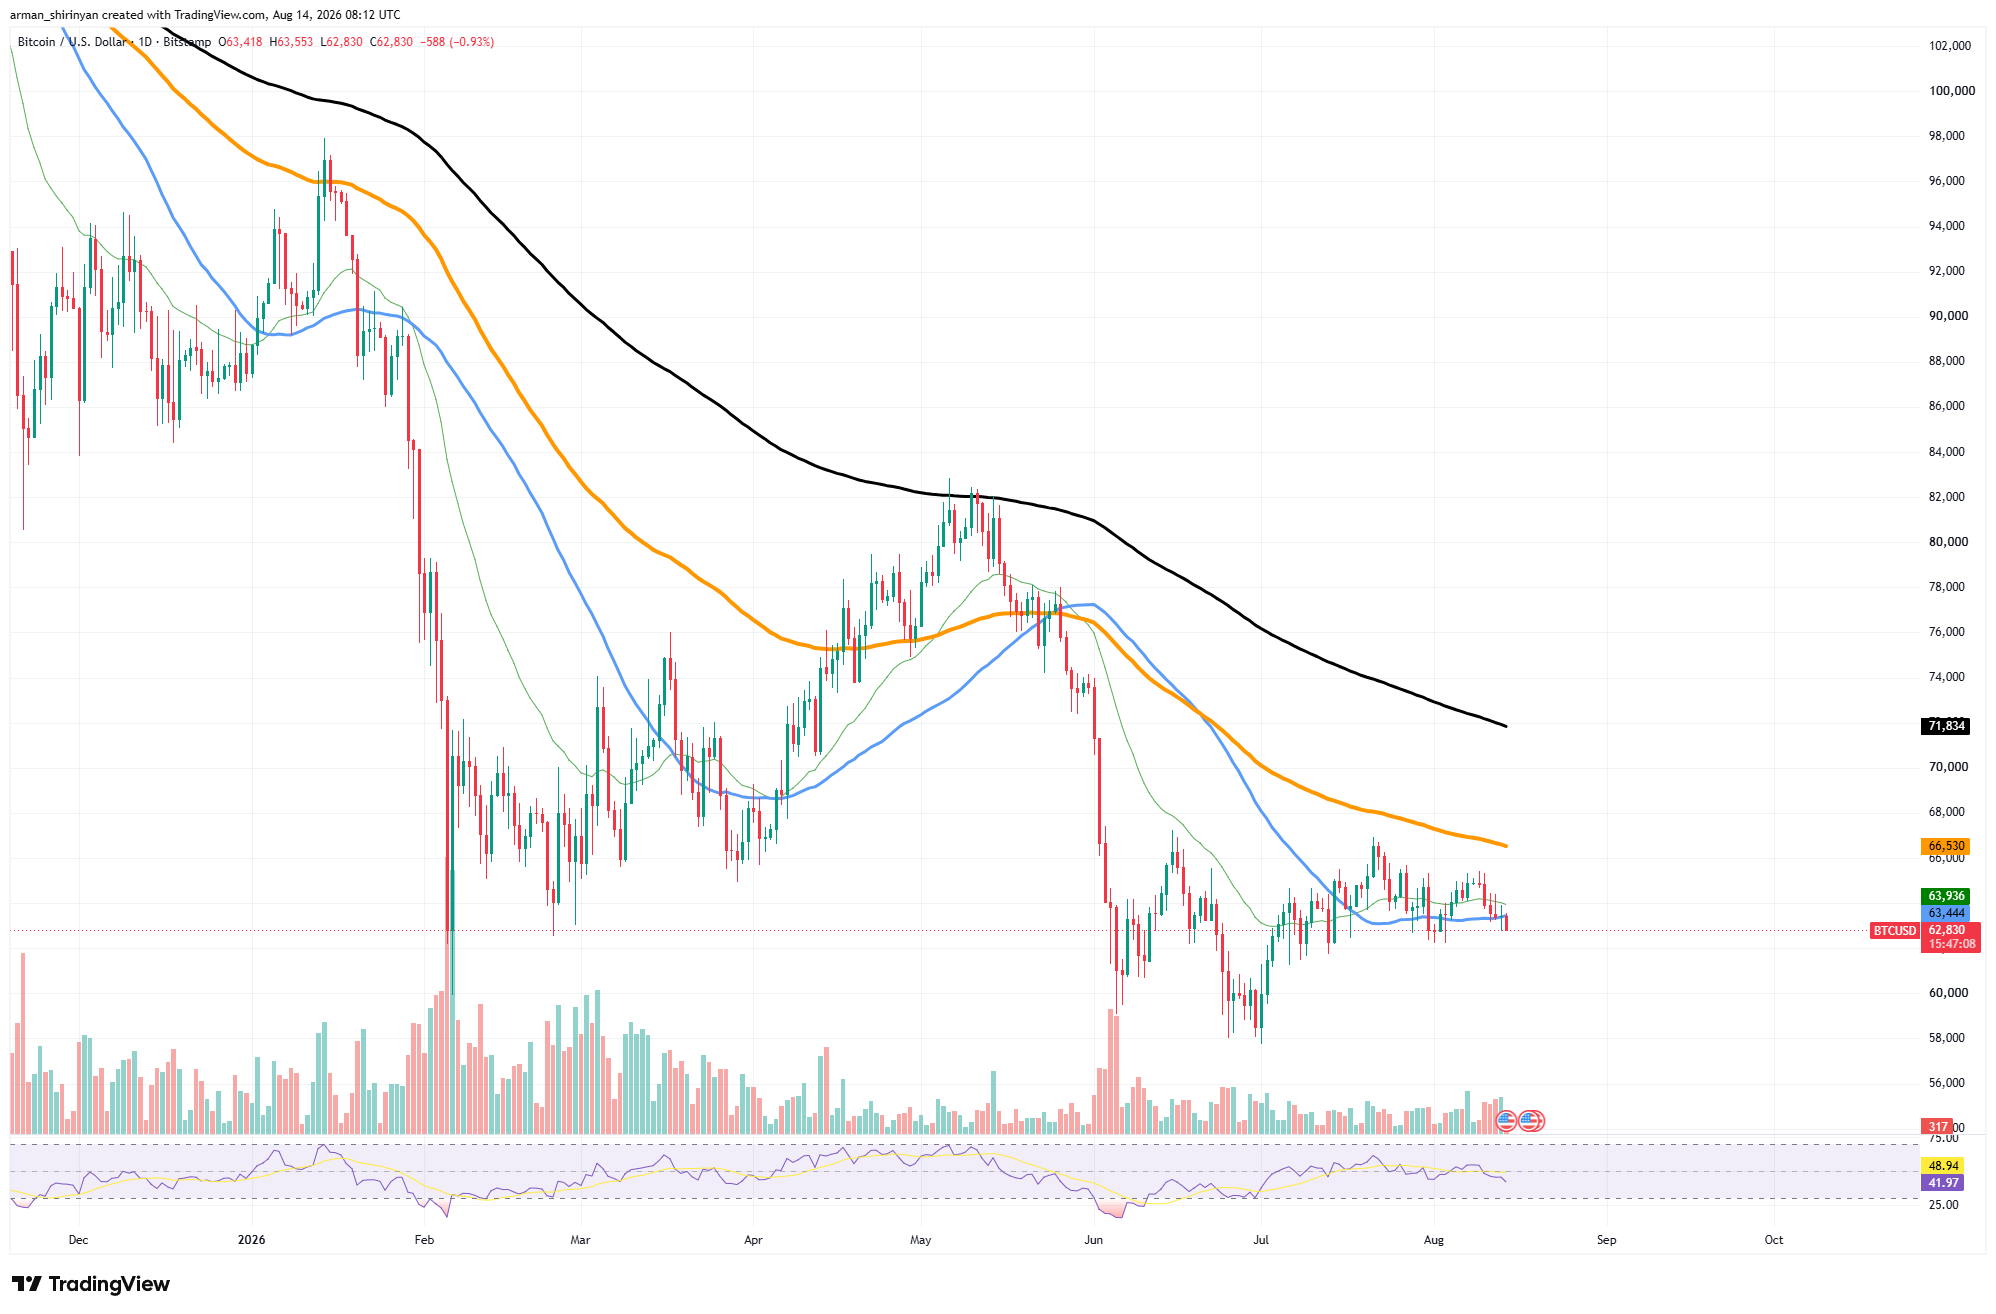
That interpretation is supported by the pricing chart. After failing to break out of its recent consolidation, Bitcoin is currently trading at about $62,900. While the 100-day moving average is still significantly higher at $66,500, $BTC has fallen below the short-term moving averages between $63,400 and $63,900. At roughly $71,800, the 200-day moving average is even farther away, putting pressure on Bitcoin's broader technical structure. Moreover, momentum is waning.
The daily RSI has dropped to about 42.5, below its signal average of about 49, though it remains comfortably above oversold territory. As a result, sellers are still able to exert more pressure. The key distinction is that, rather than predicting what will happen next, a negative 365-day ROI describes what Bitcoin has already experienced.
In the past, significant accumulation periods have seen the emergence of sharply declining annual returns, but it has proven difficult to predict these shifts based solely on ROI. As of right now, buying and holding Bitcoin for a full year has resulted in a significant loss. More than just temporary stabilization would be needed for a recovery above the 1.0 ROI threshold; $BTC would need a sustained long-term price increase that could undo a full year of underperformance.

 u.today