All about Bitcoin’s price struggles at $65K-$67K bottleneck and how it can overcome it
ambcrypto.com
07 August 2026 22:44, UTC
There is a fierce battle being waged between Bitcoin [$BTC] bulls and bears as the price climbs back above $65K once more. The on-chain metrics covered in recent days showed that strong, sustained demand is not yet present to support a bullish trend reversal.
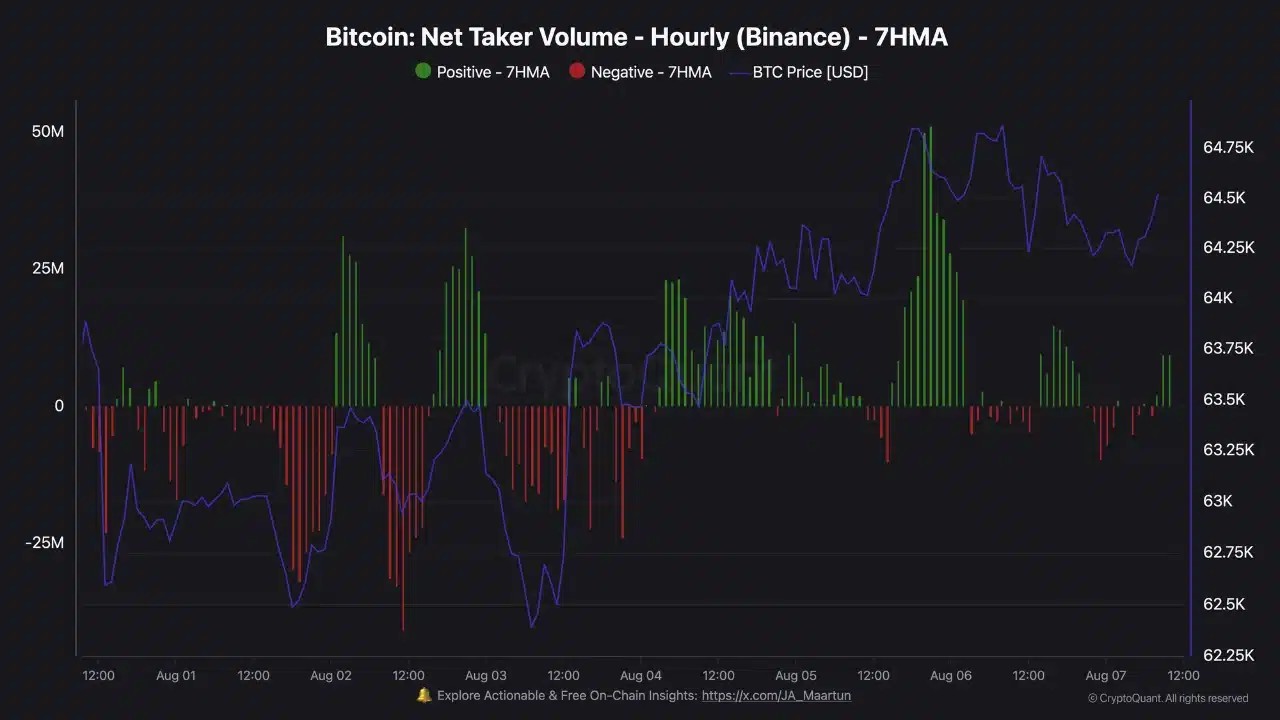
Source: CryptoQuant
On 5th August, as Bitcoin approached $65K, the centralized exchange Binance saw a spike in taker buyer volume. This buying spree was not large enough to overcome the limit sell orders sitting overhead.
Know when your coins move
Alerts, real-time prices, and market news — all in one app
Point your phone camera to install
4.8 based on 40K reviews in the App Store and Google Play
After absorbing the influx of demand, buyer exhaustion saw short-term price dips towards $64K in the last 48 hours.
The $65K-$67K zone will be key to determining the next impulse move.
What needs to happen to give Bitcoin’s price a bullish color?
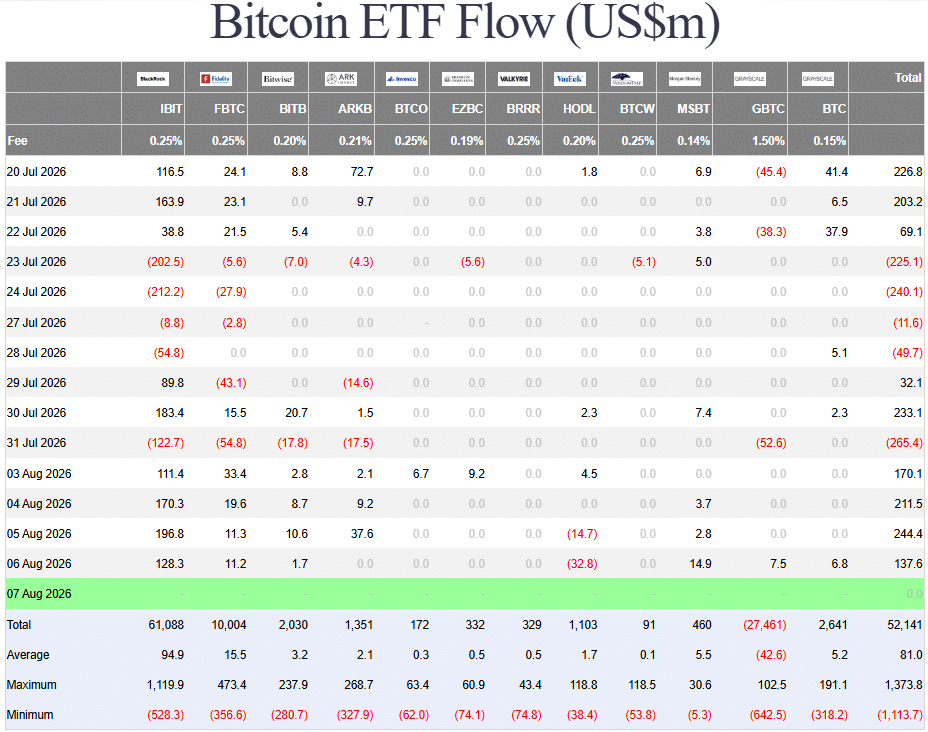
Source: Farside Investors
The Spot ETF flows were positive for the past four trading days. Since 3rd August, ETF flows measured a cumulative $763.6 million in inflows. This seemed to be an encouraging sight for the bulls gunning for a move beyond the $65K supply zone.
AMBCrypto had previously reported that HODLer accumulation was underway, but fresh capital inflows may be needed to catalyse a $BTC move higher. At the same time, there could also be room for the ongoing bear cycle to take one step lower.
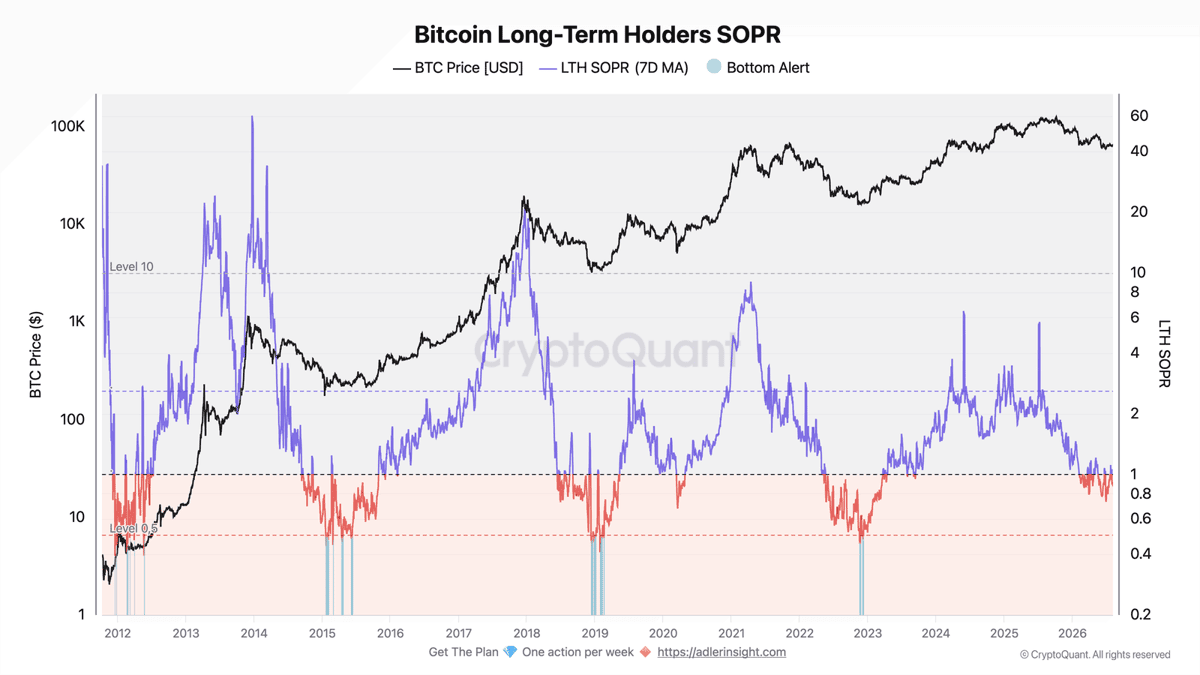
Source: Axel Adler Jr.
The LTH SOPR measures if the long-term holder coins are moving at a profit or not. Its 7-day moving average of 0.92 meant, on average, these coins were moving at a loss.
A drop towards 0.7 or lower would signal intense selling pressure from LTHs.
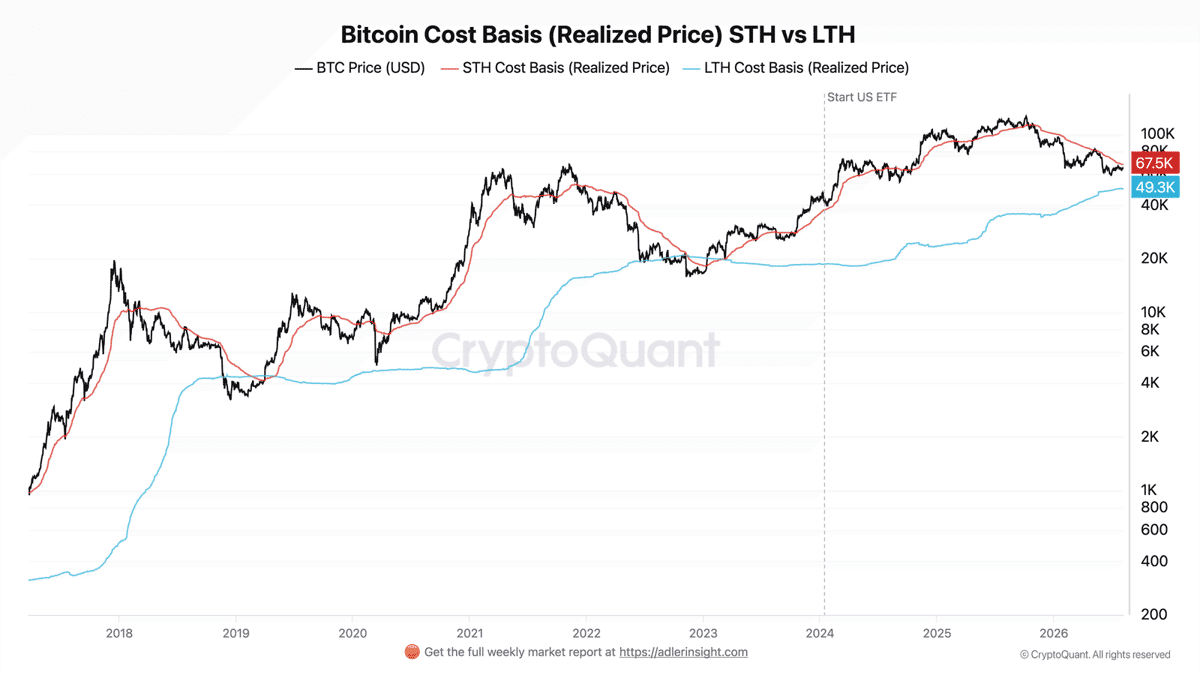
Source: Axel Adler Jr.
At the time of writing, Bitcoin’s price was 30% above the long-term holder cost basis at $49.3K, but still 5% below the short-term holder cost basis at $67.5K. Once again, the $65K-$67K area can be highlighted as an immensely important supply zone for bulls to conquer.
A price move past $67.5K and the LTH SOPR above 1 would signal a potential trend shift.
Are the current trends still firmly bearish?
Source: $BTC/$USDT on TradingView
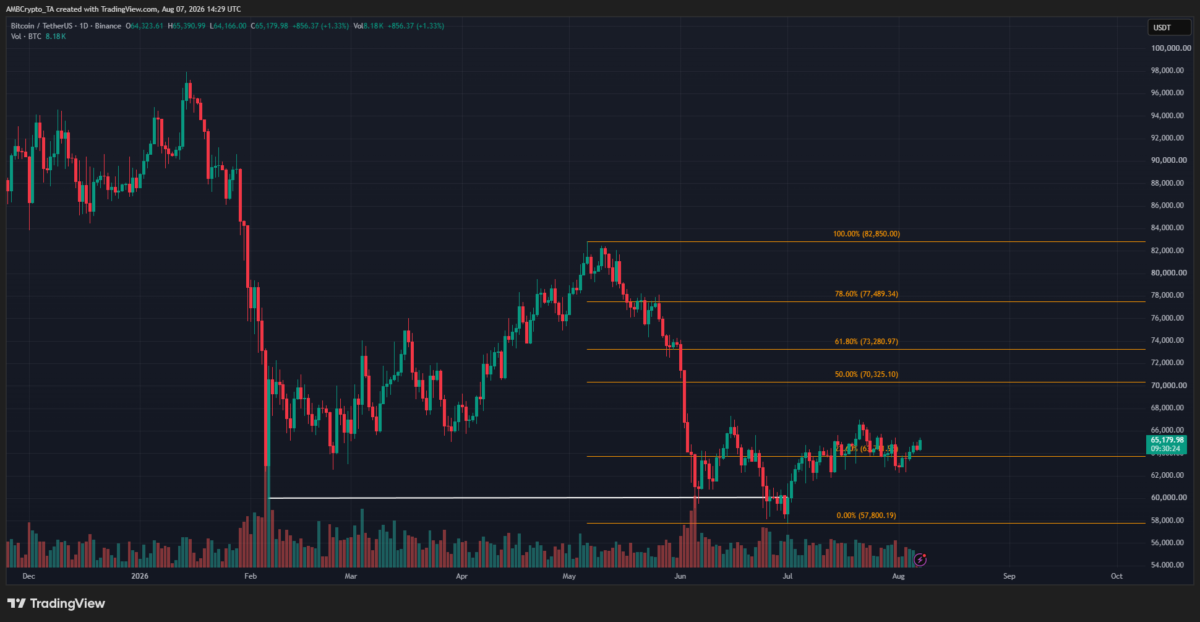
At press time, $BTC’s swing structure on the 1-day chart was bearish. The current bounce had not even reached the 50% level at $70.3K. A bounce could go as high as $77.5K-$82.8K and still maintain a bearish swing structure.
Investors could choose to wait for the $82.8K-level to be breached, along with recovery in capital flows and on-chain signals. This, before turning their long-term bias bullishly.
Source: $BTC/$USDT on TradingView
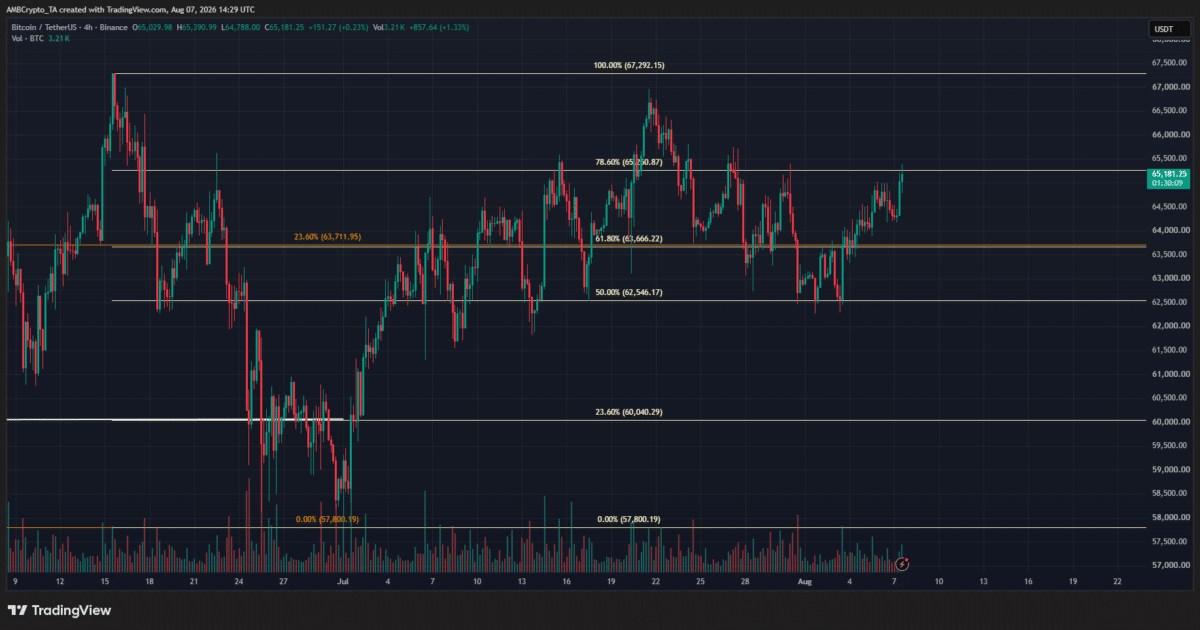
In the short-term too, Bitcoin’s price seemed to maintain a bearish bias. The $67.3K swing high from mid-June needs to be breached to give swing traders a reason to target long trades.
The sideways movement between $60K-$66.5K in July only signaled the continuation of the previous bearish trend. The $67K-bottleneck must be defeated to shift this narrative.
Final Summary
Swing levels at $67.3K and $82.8K will be key to determining Bitcoin’s price direction in the coming weeks.
Its price is still 30% above the long-term holder cost basis, with the current market stress only affecting the higher cost portion of LTH $BTC holders.

 ambcrypto.com