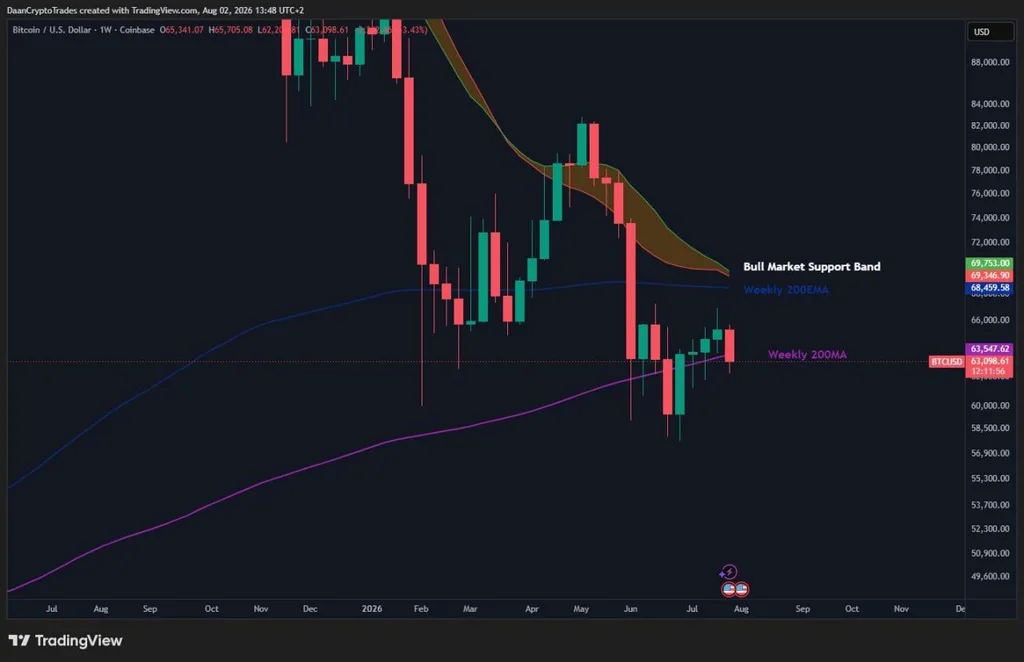
Bitcoin Weekly Chart Tests 200MA Below Bull Market Support Band. Source: Daan Crypto Trades (@DaanCrypto) on X
The weekly $BTC/USD chart places Bitcoin near $63,100, slightly below the weekly 200-period moving average around $63,548. This indicator often acts as a long-term support or resistance reference, but the weekly closing price will matter more than a brief move above or below it.
Bitcoin’s recent candles show repeated attempts to stabilize around the moving average after falling from the May high near $82,000. Buyers have defended dips below $60,000, but the recovery has not produced a decisive higher high. That leaves $BTC in consolidation rather than a confirmed bullish reversal.
The first bullish confirmation would be a weekly reclaim of the 200MA, followed by sustained trading above recent highs near $65,000 to $66,000. Bitcoin would then face the weekly 200EMA around $68,460 and the bull market support band between roughly $69,347 and $69,753. That cluster creates a major resistance area between $68,500 and $70,000.
A breakout above the full resistance cluster would improve Bitcoin’s long-term structure and support a broader recovery. Until that happens, rebounds may continue to face selling pressure.
The bearish scenario would strengthen if $BTC records a clear weekly close below the 200MA and loses the recent consolidation range. That could bring the $60,000 area back into focus, followed by the recent lows around $57,000 to $58,500.
For now, Bitcoin remains caught between long-term support and several major resistance levels. A decisive weekly close outside this range would provide stronger direction than the current low-volatility price action.
Bitcoin Rebounds From Channel Support as Long Target Hits
Bitcoin recovered after testing the lower boundary of a descending channel, allowing the chart’s long setup to reach its stated target. The bounce shows buyers defending a key demand area, but $BTC still faces resistance before the broader short-term structure can turn bullish.
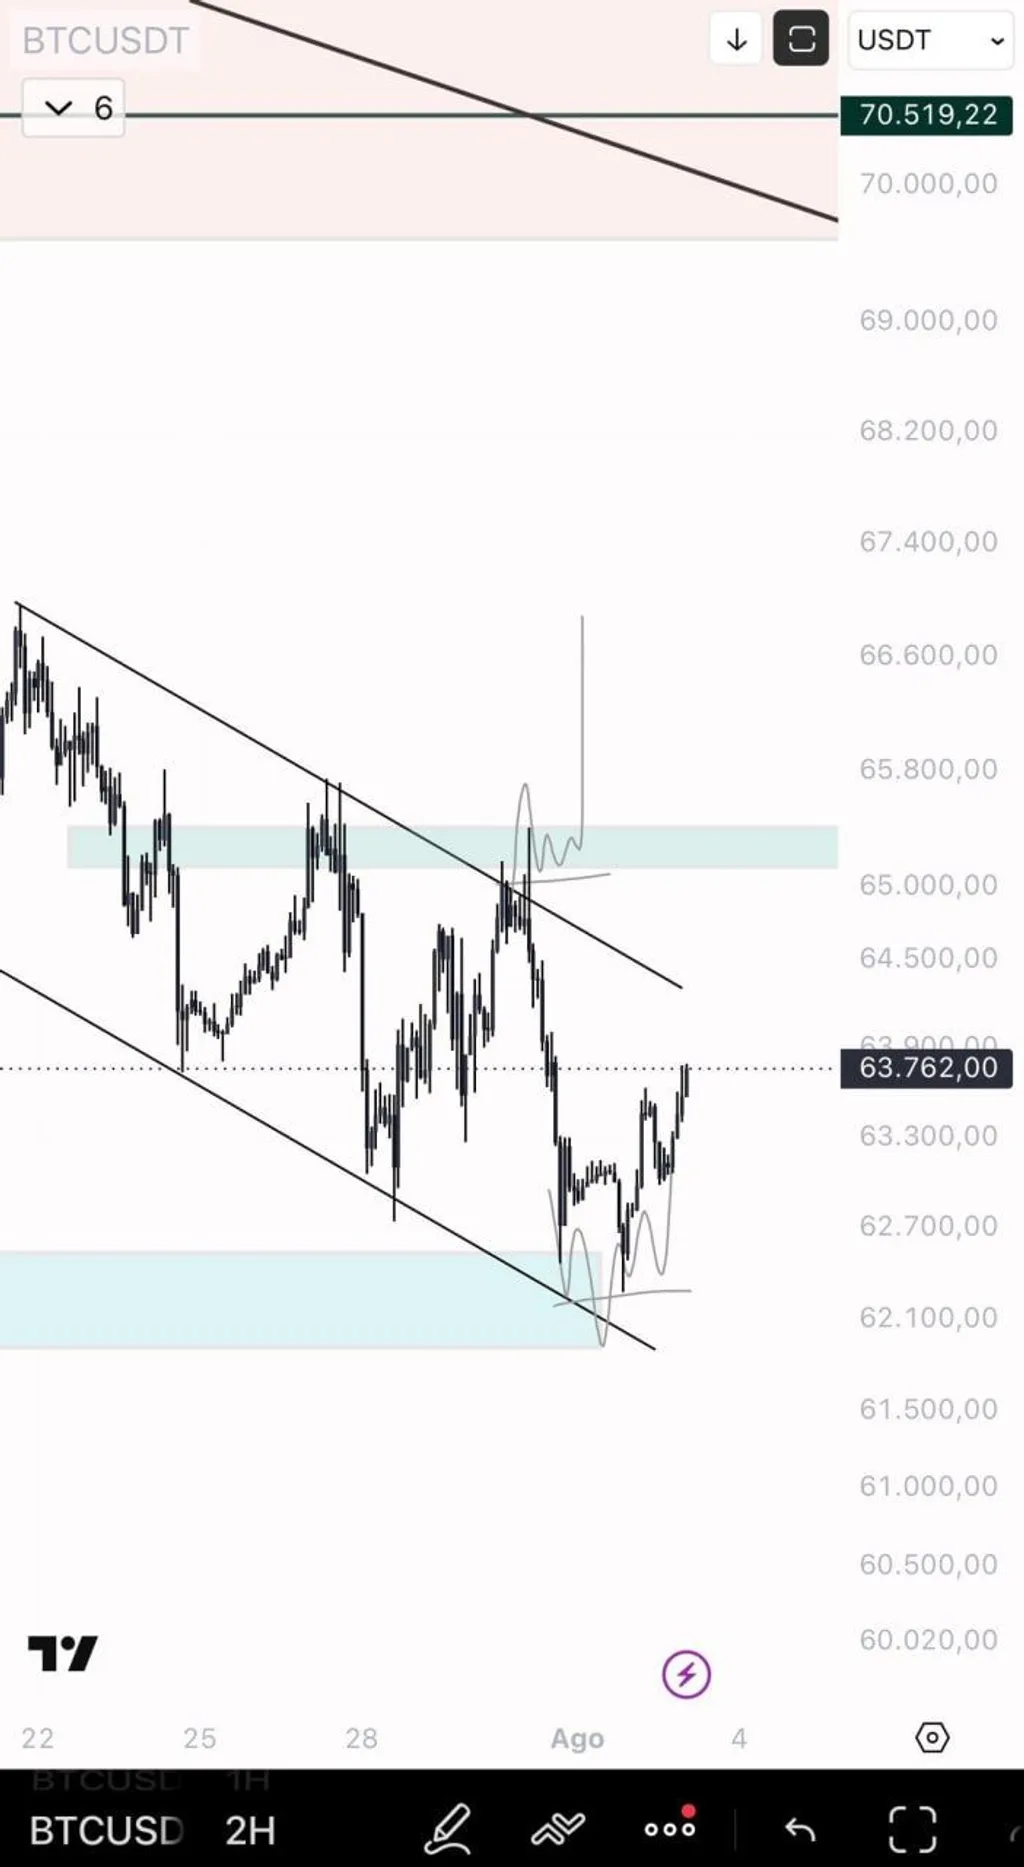
Bitcoin Two-Hour Rebound From $62,000 Support Zone. Source: EliZ (@eliz883) on X
The $BTC/USDT two-hour chart places Bitcoin inside a falling channel, with price recently testing a highlighted demand zone between roughly $62,000 and $62,500. According to the post, the long trade based on this setup reached its target and moved into profit.
The recovery from the lower channel boundary supports the idea that buyers remain active near $62,000. Bitcoin subsequently climbed toward $63,762, forming a short-term rebound from the local low. The gray projection also shows the analyst anticipating a volatile base before a stronger move higher.
However, the larger structure remains cautious while $BTC trades below the channel’s upper boundary. The first important resistance sits near $64,300 to $64,500, where the descending trendline could limit the recovery. Above that, the highlighted supply zone around $65,000 to $65,400 represents the main confirmation area.
A sustained break above the channel and the $65,400 region would strengthen the bullish scenario. Such a move could shift attention toward approximately $65,800 and $66,600, although the chart does not confirm those levels as completed targets.
The setup would weaken if Bitcoin loses the rebound structure and falls back below $62,500. A decisive break beneath the demand zone and the channel floor near $62,000 would invalidate the immediate recovery case and expose lower support.
For now, the completed long target confirms that the support reaction worked as expected. Still, Bitcoin needs to reclaim the upper channel boundary and the $65,000 area before the rebound can develop into a broader bullish breakout.

 coinpaper.com