
 finbold.com

Bitcoin ($BTC) may be entering another difficult August after a technical sell signal emerged just as the cryptocurrency enters a month that has historically produced weak returns.
The latest warning comes from the TD Sequential indicator, which flashed a sell signal on Bitcoin’s three-day chart, according to insights shared by market analyst Ali Martinez in an X post on July 31.
At the same time, historical data shows that August has been one of Bitcoin’s weakest months in recent years, raising the risk of a renewed correction in August 2026.
Data shared by Martinez shows that Bitcoin has recorded losses in every August since 2022. The cryptocurrency fell 13.88% in August 2022, followed by declines of 11.29% in 2023 and 8.60% in 2024. In 2025, Bitcoin again ended the month lower, posting a 6.49% loss.
August hasn't been kind to Bitcoin.
— Ali Charts (@alicharts) July 31, 2026
Over the past four years, $BTC has posted an average decline of 10% during the month.
Will this August break the trend? pic.twitter.com/ELkMVc5BiI
Across the last four August trading periods, Bitcoin has declined by an average of roughly 10%, making the month one of the weakest seasonal periods for the digital asset.
Although past performance does not guarantee future results, the consistency of these declines has drawn attention as investors assess Bitcoin’s price outlook for the coming weeks.
Bitcoin flashes sell signal
The bearish seasonal trend is further reinforced by a technical warning, with Bitcoin’s TD Sequential indicator printing a “9” sell signal after the asset climbed toward the $65,000 area during July. Traders commonly use the indicator to identify potential trend exhaustion and reversal points.
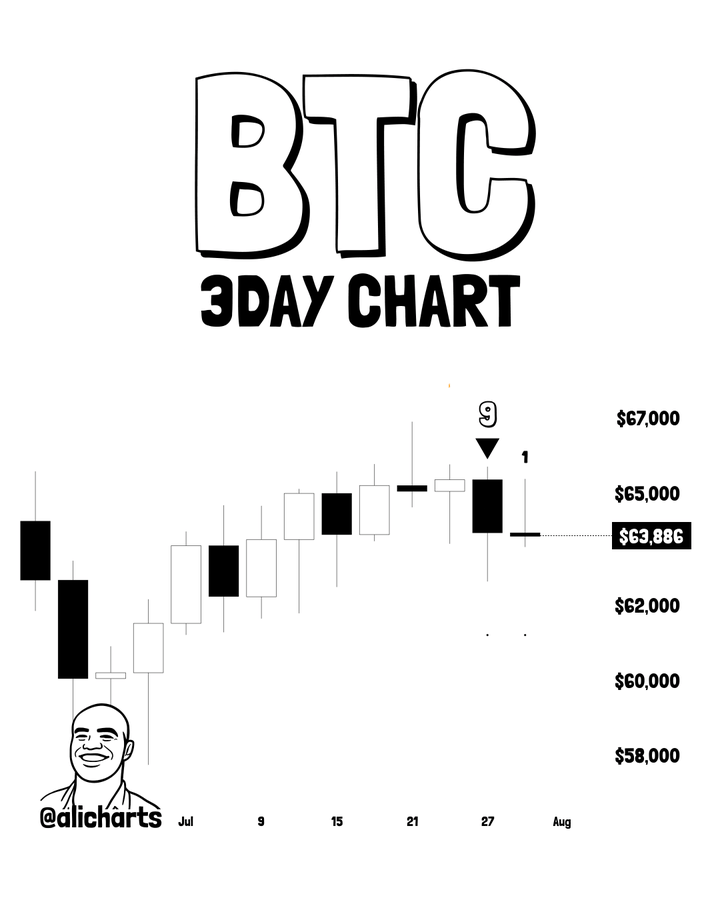
The signal appeared near recent highs, indicating weakening bullish momentum. Bitcoin was trading around $63,886 when the indicator flashed, below its recent rally peak.
Combined with August’s historically weak performance, the sell signal presents a challenging setup for bulls.
If seasonal trends persist and the TD Sequential proves accurate, Bitcoin could face further downside pressure, with traders closely watching support near $63,000.
A break below that level could trigger a deeper pullback, although strong market catalysts could still invalidate the bearish outlook.
Bitcoin price analysis
By press time, Bitcoin was trading at $63,423, up 0.65% over the past 24 hours. However, on the weekly chart, $BTC remained down about 1.5%.
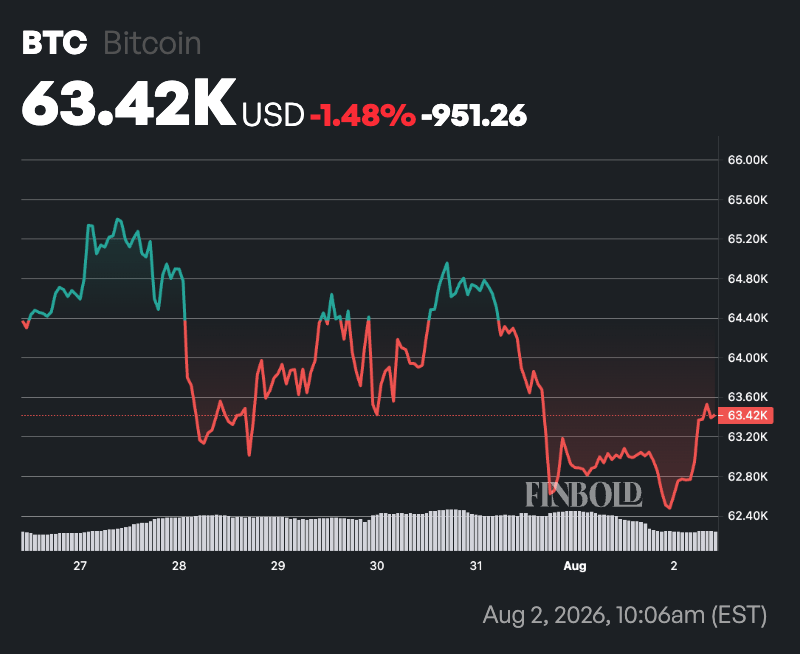
From a technical perspective, Bitcoin is trading slightly above its 50-day simple moving average (SMA) of $63,423, indicating that short-term momentum remains stable.
However, the asset is still well below its 200-day SMA of $71,335, suggesting the broader trend remains bearish.
Meanwhile, the 14-day relative strength index (RSI) stands at 43.87, a neutral reading that leans slightly bearish. This suggests selling pressure has eased, but buying momentum remains too weak to signal a sustained recovery.