Bitcoin One-Hour Reversal and Downside Roadmap. Source: Man of Bitcoin (@Manofbitcoin)
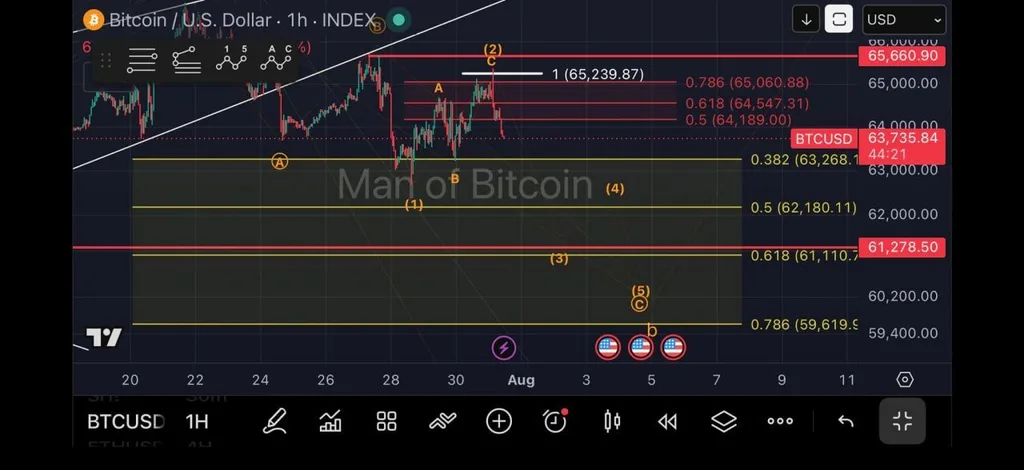
Bitcoin is trading near $63,736 after failing to hold the advance toward $65,239.87. The rejection followed a three-wave recovery marked A-B-C on the chart, supporting the analyst’s view that the move higher may have been corrective rather than the start of a sustained bullish trend.
The first immediate resistance sits near $64,189, followed by $64,547 and $65,061. $BTC would need to recover these levels to challenge the recent target area again. The chart’s broader invalidation level appears near the last major swing high at $65,660.90. A sustained move above that barrier would weaken the projected bearish sequence.
On the downside, $63,268 is the first support level to monitor. A confirmed hourly break below that area would strengthen the case for a move toward $62,180, which corresponds with the chart’s 0.5 retracement level.
A deeper decline would place the $61,278-$61,111 region in focus. The overlap between the horizontal support line and Fibonacci level makes this a potentially important reaction zone. Buyers would need to defend that area to prevent the bearish structure from extending further.
The final target shown on the roadmap sits near $59,620. The Elliott Wave annotations suggest that Bitcoin could reach this area during a fifth and final downward leg, although the move would require $BTC to lose each intermediate support level first.
For now, the practical takeaway is that Bitcoin remains vulnerable while it trades below the $65,239-$65,661 resistance region. A break under $63,268 would confirm renewed downside momentum, while a recovery above the latest swing high would challenge the bearish outlook.
Bitcoin’s Monthly Imbalance Zone Sets Up a $67,000-$68,000 Test
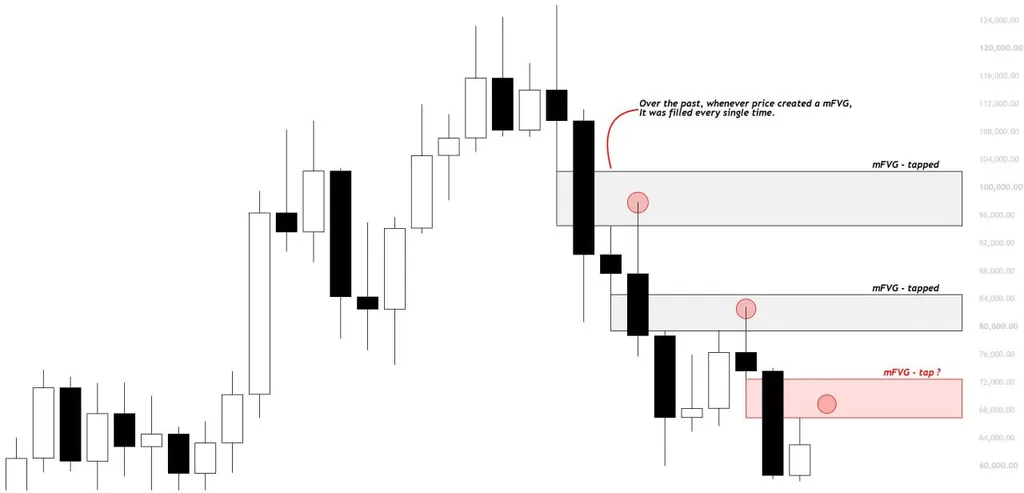
Bitcoin’s higher-time-frame chart highlights a newly formed monthly fair value gap, or mFVG, above the current market. Kaz expects price could first move into that imbalance zone before rejecting, although a direct decline toward $60,000-$61,000 remains possible.
Bitcoin Monthly Fair Value Gap Between $67,000 and $72,000․ Source: Kaz (@XBTkaz)
The chart places the new monthly imbalance zone at roughly $67,000 to $72,000, with the analyst focusing on the lower portion near $67,000-$68,000. A fair value gap represents an area where price moved quickly and left limited trading activity, creating a zone the market may revisit.
Two older monthly gaps shown higher on the chart were later entered by price. That history supports the possibility of Bitcoin revisiting the latest imbalance, but it does not guarantee that every future gap will be filled.
Kaz’s preferred scenario begins with a move toward $67,000-$68,000 as the new monthly candle develops. A rejection from that area could then restart the decline toward $60,000-$61,000, where the analyst would consider a higher-time-frame long setup.
Confirmation of the bearish scenario would require Bitcoin to reach the imbalance zone and show clear rejection rather than holding inside or above it. Failure to sustain the move would suggest that sellers continue to control the broader structure.
Bitcoin could also fall directly toward $60,000-$61,000 without first testing the monthly gap. That possibility explains why the analyst remains out of the market while waiting for price to reach one of the marked higher-time-frame areas of interest.
The bearish setup would weaken if Bitcoin reclaims the gap and establishes support above its upper boundary near $72,000. Until then, $67,000-$68,000 acts as a potential resistance and short-entry region, while $60,000-$61,000 remains the main downside reaction zone.

 coinpaper.com