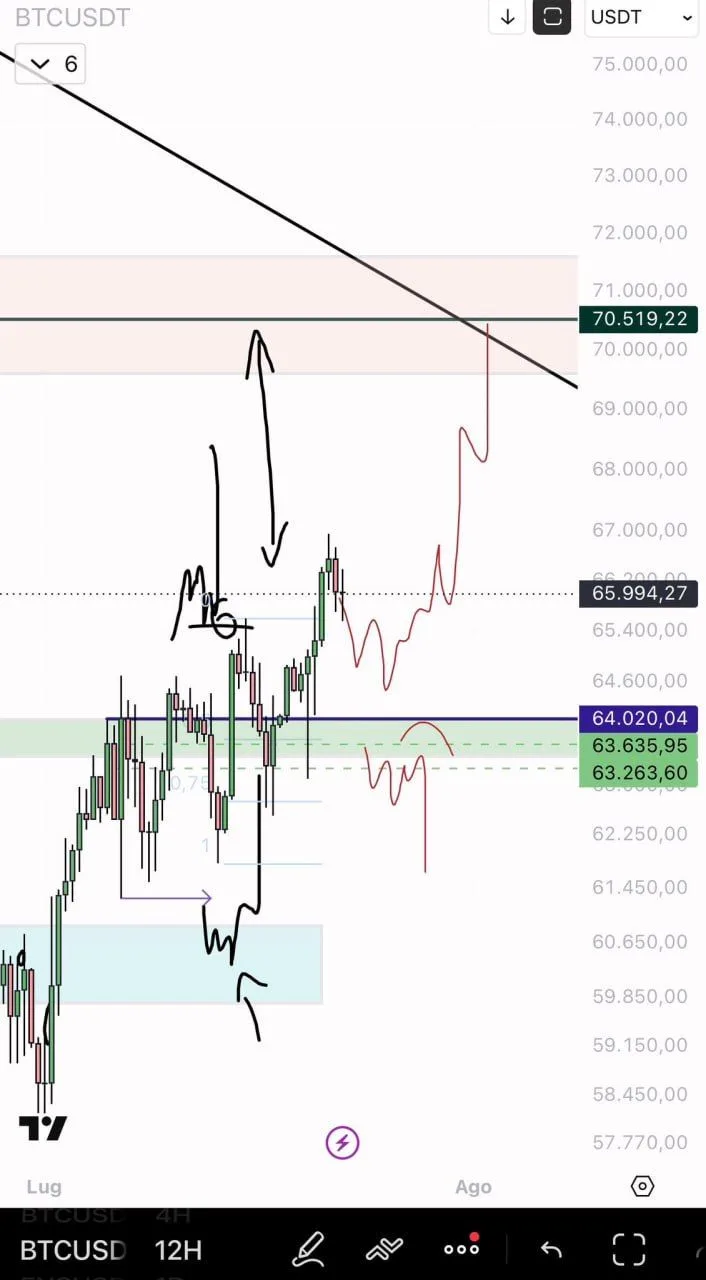
$BTC 12-hour chart. Source: EliZ/X
The wider support zone extends from roughly $63,250 to $64,000. Continued buying in this area could support another move toward the $70,000–$73,000 resistance region, where Bitcoin also faces a descending trendline.
However, a confirmed break below $63,000 would signal weakness and invalidate the immediate bullish setup. That could expose support around $60,000 and return Bitcoin to a more difficult consolidation phase.
CLARITY Act Speculation Adds New Risk to Bitcoin
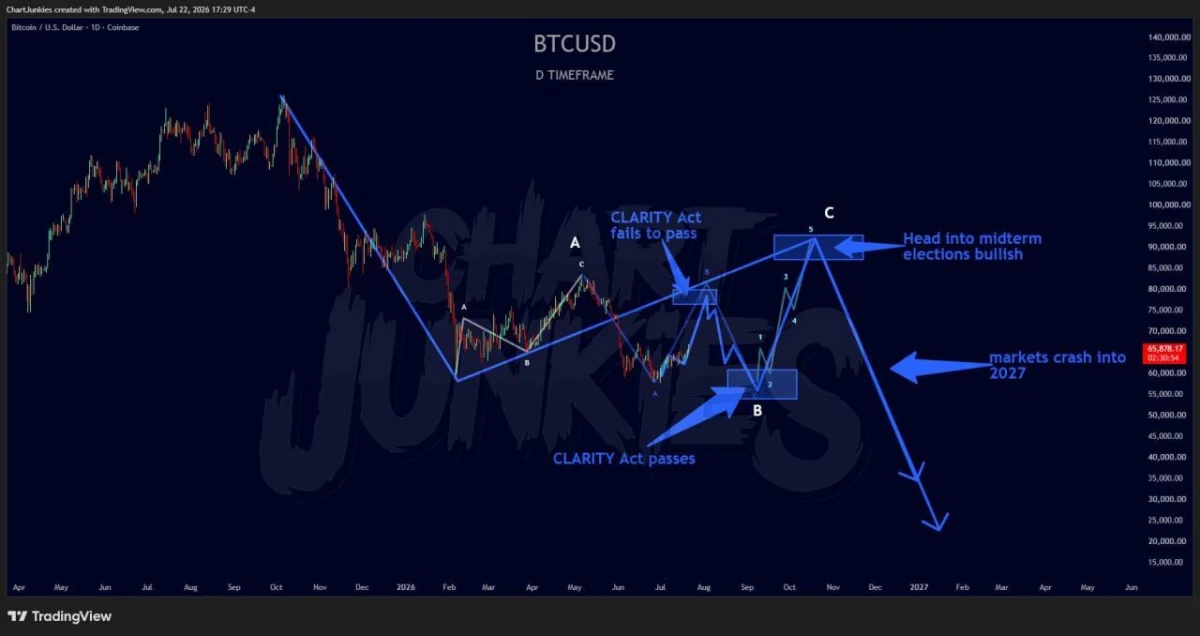
Bitcoin analyst Junkie expects the CLARITY Act to shape $BTC’s next major moves. His scenario calls for an initial rally, an August decline toward $55,000, a September recovery and a much larger sell-off entering 2027.
$BTC daily chart. Source: Junkie/X
However, this timeline is highly speculative. The Senate Banking Committee advanced the bill 15–9 in May, but it has not passed the full Senate or become law. Updated language released on July 22 also drew fresh political opposition, showing that negotiations remain unsettled. Senate Banking Committee, minority statement
The chart places possible resistance around $75,000–$80,000 and $88,000–$93,000, with downside liquidity near $55,000. Still, no technical evidence can confirm the analyst’s exact legislative schedule or forecast a crash into 2027. Bitcoin’s reaction would also depend on the final bill, broader liquidity and market conditions.

 coinpaper.com