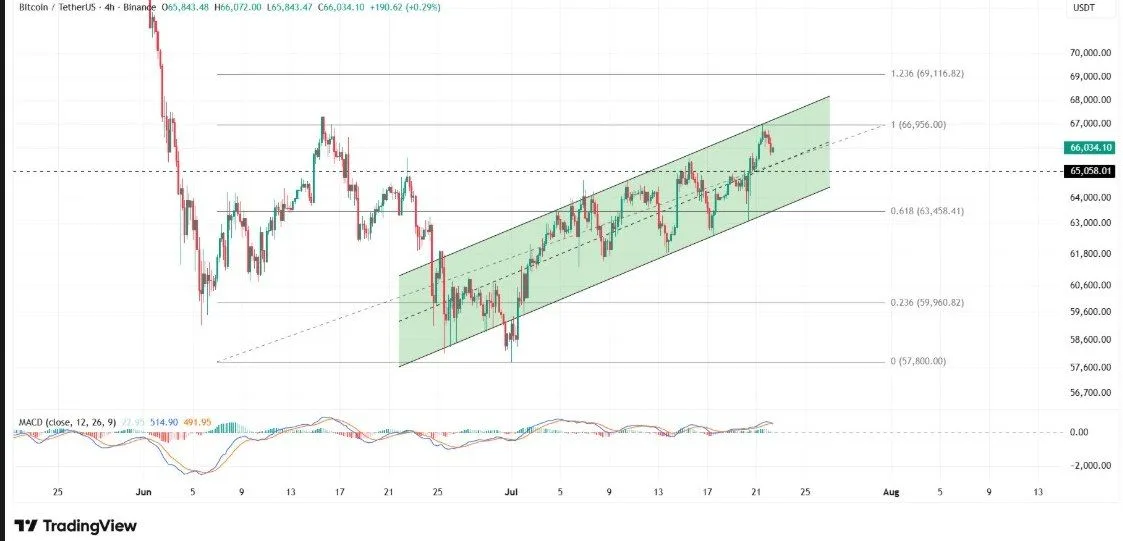
The four-hour chart places $65,000 near the middle of a rising parallel channel. A sustained close below that line could expose the 61.8% Fibonacci level near $63,458. Buyers would need to defend that zone to preserve the current structure.
$BTC/USD 4 Hr Chart | Source: TradingView
A break above channel resistance at $66,956 would open the next technical level near $69,116. Trading volume and the next daily close will help confirm either move.
Donald Trump Threatens New Strikes on Iran
Trump said the United States would continue its campaign after the military completed an eleventh straight night of strikes. He also said US forces could soon hit Pickaxe Mountain, a deeply buried site near Natanz. Western governments suspect Iran may use the complex for advanced uranium enrichment, although inspectors have not accessed the facility.
Iran’s military command threatened attacks on American interests and allied facilities if Washington strikes the site. Tehran also launched drone and missile attacks toward US-linked targets in Kuwait, Bahrain and Jordan.
Gulf states reported interceptions as air defense systems responded. The wider confrontation has disrupted shipping routes around the Strait of Hormuz and Red Sea, adding pressure to global energy markets. US officials still say Washington remains open to negotiations.
ETF Inflows Support Bitcoin Demand
US spot Bitcoin ETFs recorded about $226.92 million in net inflows on July 20. The session marked a fifth consecutive day of positive flows. BlackRock’s IBIT attracted roughly $116 million, while ARKB added about $72.74 million. The inflow streak gives Bitcoin a source of demand while geopolitical risk remains elevated. It also follows several weeks of uneven fund activity during the broader market correction.
Large holders have also increased their balances during the recent correction. CryptoQuant data showed wallets holding 1,000 to 10,000 $BTC added about 48,000 coins over the past month. Their combined balance reached roughly 3.09 million $BTC. Separate data showed whales accumulated more than 270,000 $BTC during a two-week period earlier in July.
Bitcoin Bulls Watch $66,956 Resistance
Momentum indicators still favor buyers while Bitcoin holds inside the rising channel. The MACD line remains above its signal line, while the ADX continues to rise. These readings show that the current upward move retains strength. Still, traders need a confirmed close above $66,956 before the chart signals a move toward $69,116.
A fall below $65,000 would shift attention back to $63,458. Fresh military attacks, higher oil prices or blocked shipping routes could weaken demand for risk assets. Continued ETF inflows and whale accumulation could limit near-term selling pressure. Bitcoin’s next move now rests on whether buyers protect $65,000 during the latest US-Iran escalation.

 coinpaper.com