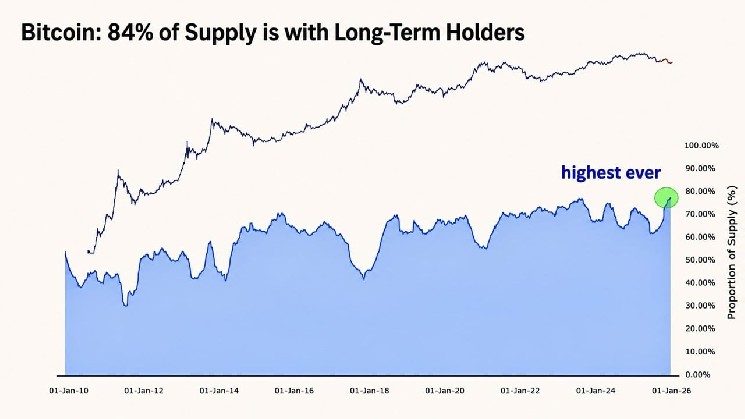
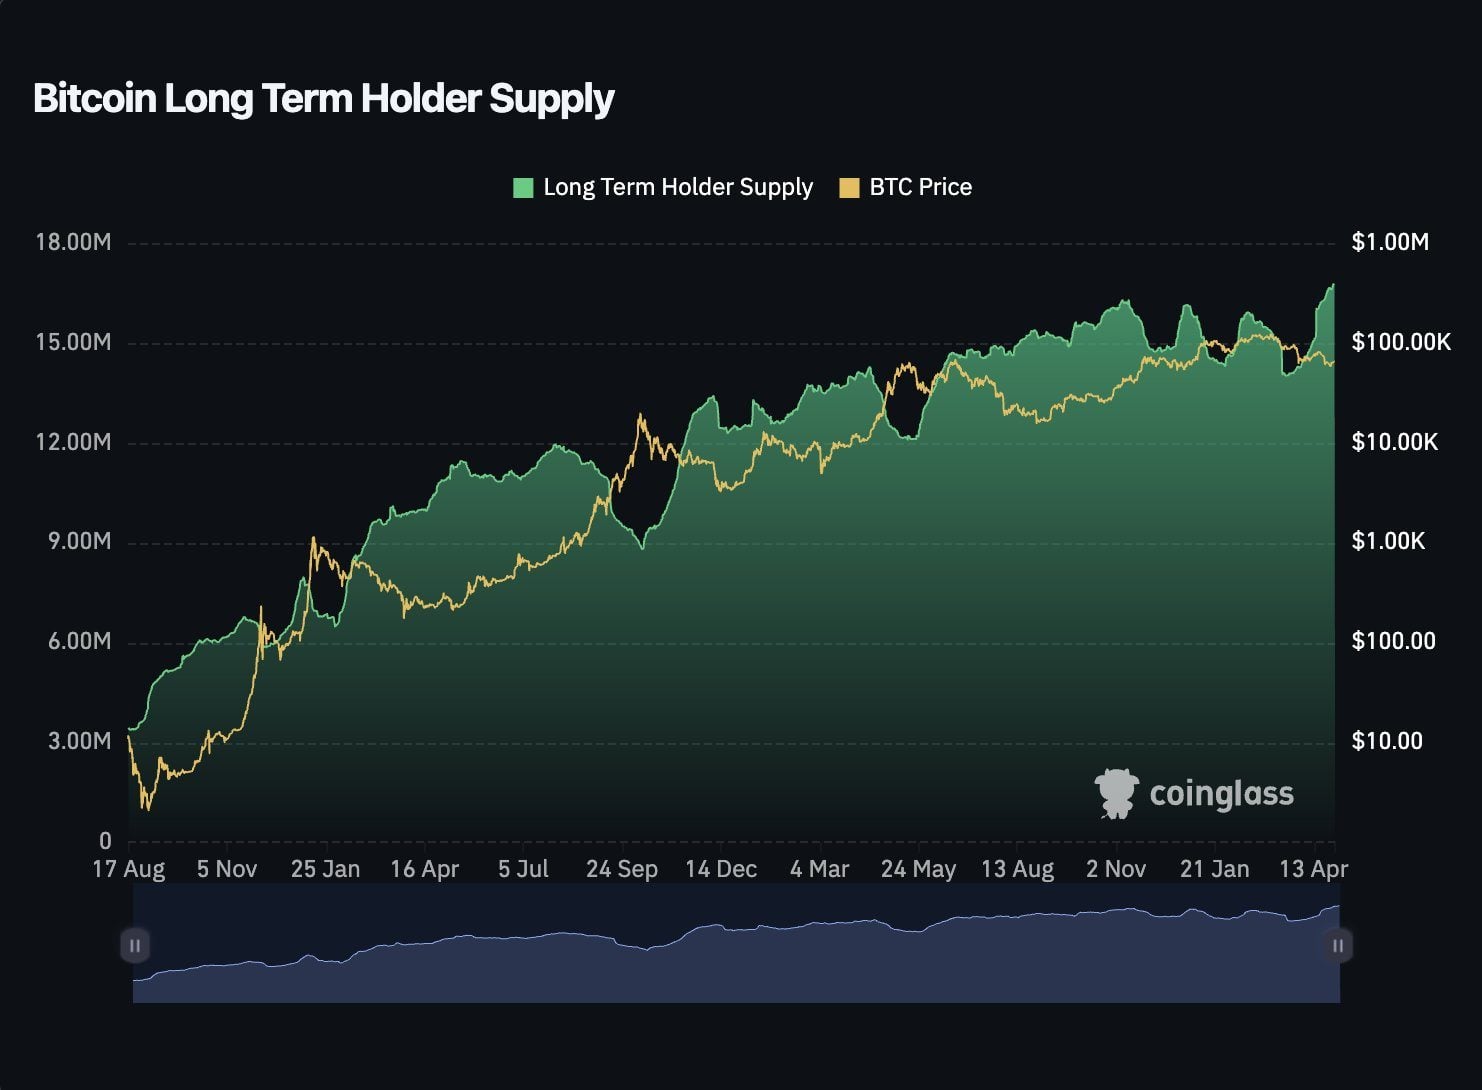
By May, the metric had broken out of that downtrend and climbed back to about 16.3 million $BTC, adding more than 2 million coins during the broader bear market and rising at a pace of roughly 200,000 $BTC a month. By June, it had cleared its old high to reach the fresh record of 16.64 million $BTC, worth about $1.07 trillion with bitcoin trading near $64,100 at the time.
Whales Buying, Retail Selling
The composition of who is buying matters as much as the total, with Cryptoquant CEO Ki Young Ju recently pointing to a specific dynamic behind the climb, noting that “Strategy and ETF buyers absorbed large old-whale selling.” In other words, some of bitcoin’s earliest, largest holders have been distributing coins even as new long-term buyers, corporate treasuries like Strategy and spot ETF vehicles among them, step in to absorb that supply and hold it for the long run.
Bitcoin.com News has tracked a similar pattern building since mid-February, when long-term holders returned to accumulation mode and Binance data pointed to tightening supply conditions consistent with the early stages of a new market cycle.
A related shift has also shown up in wallet-size data, i.e. large whale wallets have added tens of thousands of $BTC in recent months even as mid-tier holders sold, a redistribution that further concentrates supply among wallets less likely to sell into short-term price swings.
What Rising HODLing Usually Signals
The behavior lines up with a pattern long-term holders have shown in past cycles. Coins held for more than 155 days tend to get accumulated during price weakness and distributed during price strength, a rhythm previously documented through HODL wave maps showing large shares of supply going untouched for years at a time. Similar buildups occurred during the 2015 and 2019 bear markets, both of which preceded periods of renewed price strength once demand returned.
The practical effect of rising LTH supply is a shrinking liquid float because as more $BTC gets locked away by holders with no near-term intention to sell, the amount available for active trading on exchanges declines, a dynamic that has historically amplified price moves in either direction once demand shifts meaningfully.
Analysts caution the metric shouldn’t be read in isolation, however, since accumulation alone doesn’t guarantee a price reaction without a corresponding demand catalyst.
Crypto staking platform Everstake postured the record more cautiously, noting that “the price may move up and down, but the network keeps improving,” a reminder that supply-side metrics track investor behavior and network health rather than predicting near-term price direction on their own.

 news.bitcoin.com