
 coinpaper.com

Bitcoin is holding above $61,000, keeping a short-term recovery alive. However, a sweep toward $64,650-$65,550 could trap late buyers before $BTC turns back toward $59,900-$60,900.
Bitcoin Holds $61,000 as Bulls Target a Stronger Recovery
Bitcoin continues to consolidate above the $61,000 area after recovering from its late-June low. The structure remains cautious, but buyers have kept the market from returning to its recent lows.
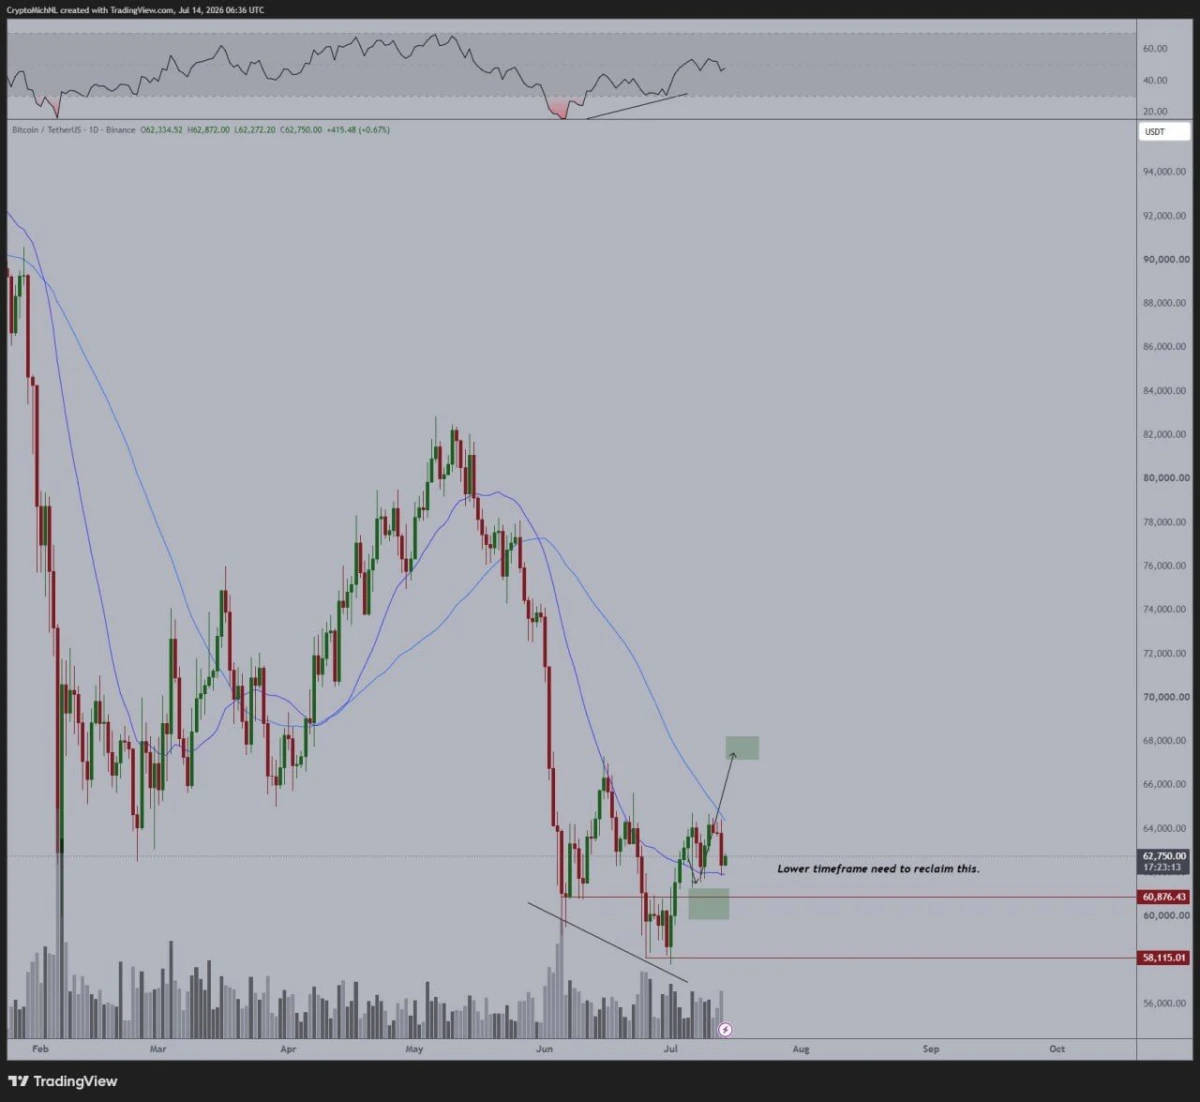
$BTC daily chart. Source: Michaël van de Poppe/X
The chart shows Bitcoin holding above the key $60,876 support level after bouncing from the broader base near $58,115. Momentum has also improved, although price remains below the declining moving average around $64,000-$65,000.
Reclaiming that moving average would mark an important change in the short-term structure. It could open the way toward the $67,000-$68,000 region, where the chart identifies the next potential resistance zone.
Van de Poppe also points to mixed macro signals, with higher oil prices creating pressure while falling Japanese bond yields may support risk assets. This combination could keep Bitcoin moving sideways until the market finds a clearer direction.
The setup would weaken if Bitcoin loses $60,876 and fails to recover quickly. That would bring $58,115 back into focus, while continued strength above $61,000 keeps the recovery scenario alive.
Bitcoin Could Sweep $65,500 Before a Deeper Sell-Off
Bitcoin may be setting up for a short squeeze after trapping late sellers near $62,000. The chart points to a possible move into the $64,650-$65,550 liquidity zone before a reversal toward lower support.
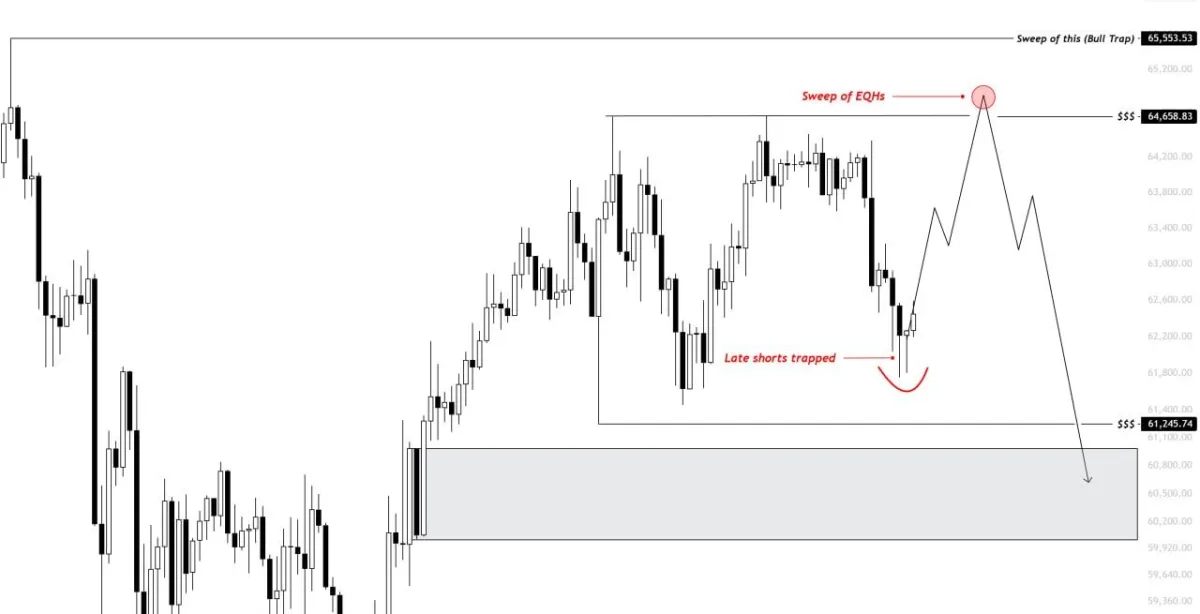
$BTC intraday chart. Source: Kaz/X
The equal highs near $64,658 form an obvious pool of liquidity above the current range. A rebound into that level could force short positions to close and attract breakout buyers, providing enough momentum for a brief push toward $65,553.
However, the projected rise is treated as a liquidity sweep rather than a confirmed bullish breakout. A quick rejection and return below $64,658 would suggest that buyers failed to hold the move, increasing the risk of another decline.
The first important downside level sits near $61,245, which marks the lower boundary of the range. Losing that support could send Bitcoin into the broader $59,900-$60,900 demand zone shown on the chart.
Kaz also expects a larger correction toward the low-$50,000 area later in July or early August. That target remains speculative and would require Bitcoin to lose the current demand zone and continue forming lower highs.
The bearish setup would weaken if Bitcoin clears $65,553 and holds above it. In that case, the liquidity sweep could develop into a genuine breakout rather than the expected bull trap.