
 coinpaper.com

Bitcoin is flashing bearish-looking macro signals, but past cycles show these moments often appeared near bear market exhaustion. If $BTC keeps holding its broader range, the current setup could mark another long-term accumulation phase before a larger recovery.
Bitcoin Weekly Death Cross May Signal Bear Market Exhaustion
Bitcoin is flashing a weekly death cross, but one analyst says the signal has often appeared near the later stages of previous bear markets. If history repeats, the warning may point less to fresh panic and more to a possible bottoming phase.
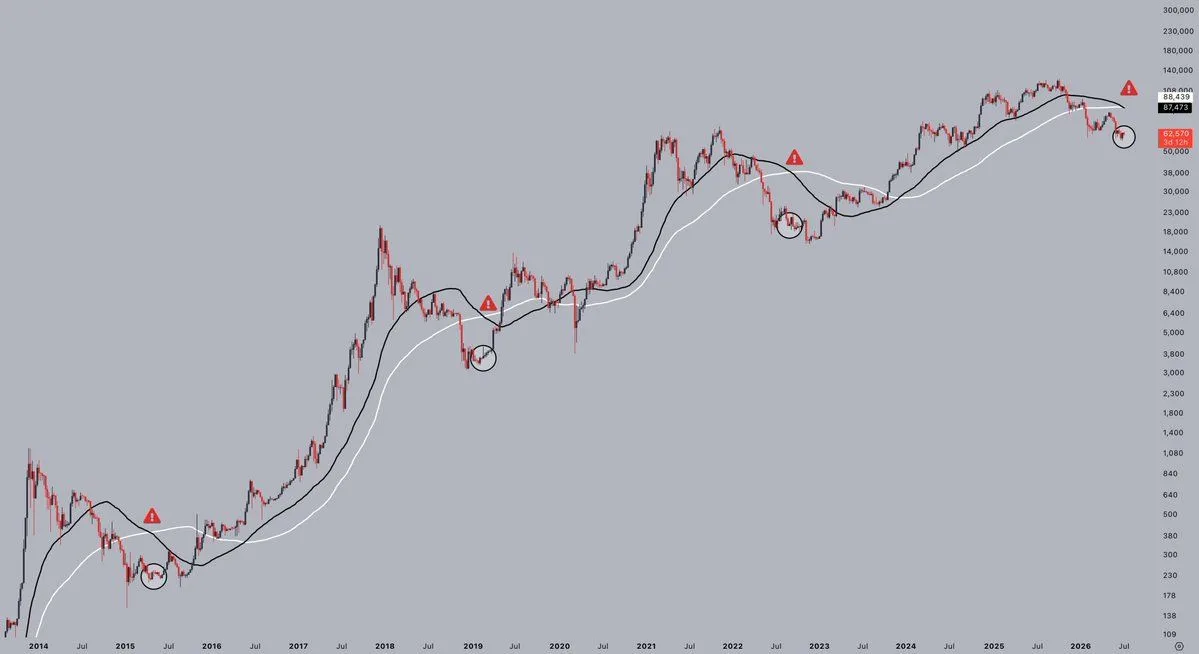
$BTC weekly chart. Source: Jelle on X, TradingView
The chart shows Bitcoin’s weekly moving averages crossing after a long period of market weakness.
A death cross usually happens when a shorter-term moving average falls below a longer-term moving average. Traders often read it as a bearish signal because it shows momentum has weakened.
However, Jelle noted that Bitcoin’s bear markets have historically been close to ending by the time this signal appears. On the chart, previous death cross areas are marked near major late-stage correction zones.
That makes the current signal important. While it confirms that Bitcoin has been under pressure, it may also suggest the market is moving into a more mature phase of the downtrend.
The chart also shows past examples where Bitcoin continued to trade weakly for some time after the signal before eventually forming a stronger base.
For now, the death cross is not a clean bullish trigger. $BTC still needs stronger confirmation, including reclaiming key moving averages and breaking higher resistance.
Still, the signal adds to the idea that the market may be closer to exhaustion than the start of a new major decline. Holding the current range and building higher lows would strengthen that case.
Bitcoin Macro Signal Points to Possible Bottoming Phase
Bitcoin is testing a long-term cycle area that has appeared near major market lows in previous years. One analyst says the setup supports a bullish view, as the lower oscillator zone has historically aligned with late-stage bear market conditions.
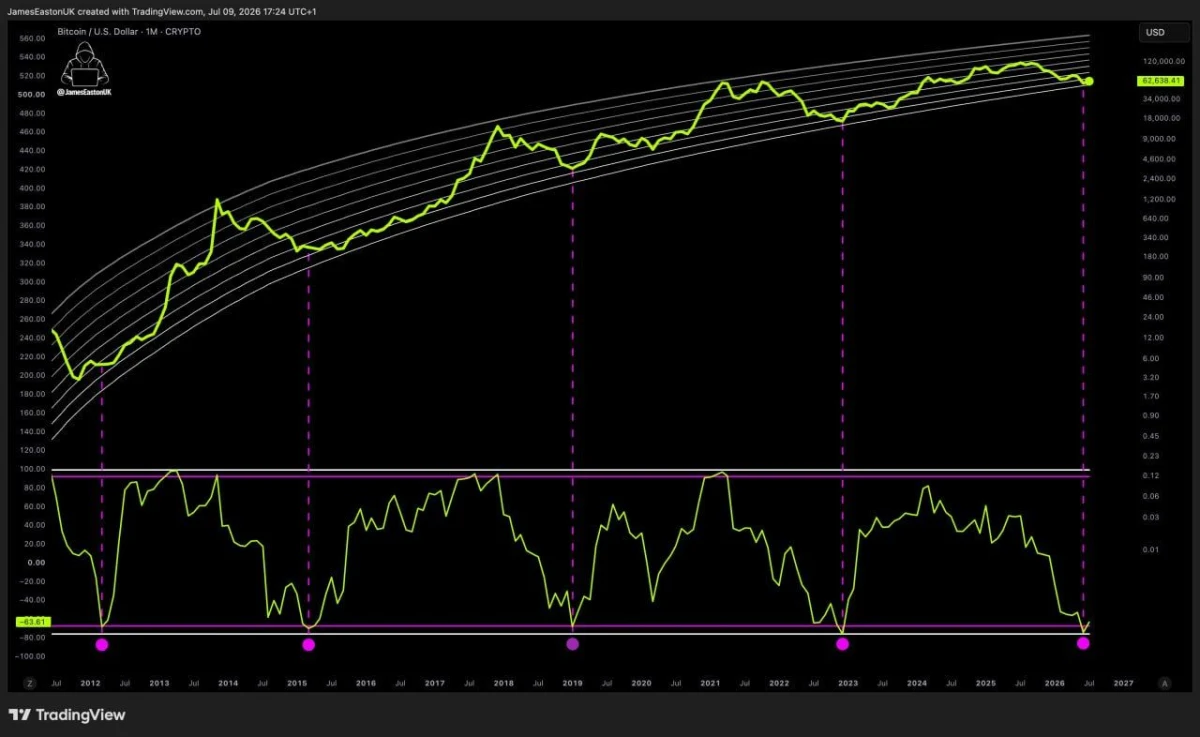
$BTC monthly macro chart. Source: James on X, TradingView
The chart shows Bitcoin moving inside a long-term logarithmic growth channel, with price near the lower side of the broader structure.
Below the price chart, the oscillator has dropped into the same lower extreme zone that appeared near earlier cycle bottoms.
Those past signals are marked around previous major low areas, including the 2012, 2015, 2019 and 2022 periods. Each time, $BTC later moved into a larger recovery phase after the macro setup matured.
According to James, the current structure supports a bullish long-term view. The idea is that Bitcoin may be closer to a cycle bottoming phase than the start of a fresh major decline.
However, the signal is not a short-term breakout confirmation. $BTC still needs stronger momentum, higher lows and a reclaim of key resistance levels before the bullish case becomes more reliable.
For now, the macro oscillator is the main signal. If history repeats, Bitcoin may be forming another long-term accumulation area before the next larger expansion phase.