
Bitcoin is testing a major support area that has shaped past cycle bottoms and sparked strong rallies before. The $58,000 to $62,000 zone now matters because holding it could keep the bullish reversal setup alive, while losing it may point to deeper downside.
Bitcoin Chart Shows Long-Term Channel Support as Bottom Zone to Watch
Bitcoin is moving lower inside a long-term rising channel, with one analyst watching whether the lower boundary can once again act as a major cycle support zone.
The weekly chart shows $BTC trading inside a broad ascending channel that has guided price action since 2018. The lower trendline has marked previous bottom areas, including the 2020 and 2023 lows.
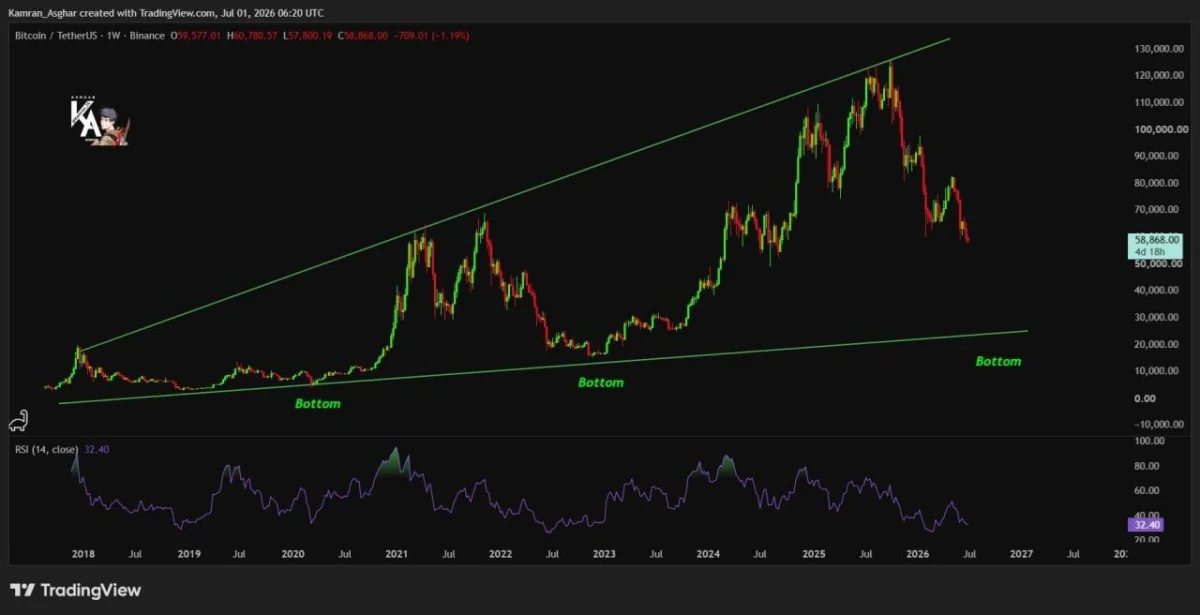
$BTC/$USDT weekly chart. Source: Kamran Asghar on X, TradingView.
That matters because each major test of this rising support has previously led to a broader recovery. If Bitcoin continues moving toward the lower boundary and buyers defend it again, the area could become a base for the next bullish reversal.
The chart also shows weakening momentum, with RSI moving near the lower part of its range. That signals pressure remains on bulls, but it can also become important if Bitcoin starts forming a higher low near channel support.
For now, the setup is not confirmed. Bitcoin still needs to show a strong reaction from the lower channel area before traders can treat it as a bottom.
A stronger bullish signal would come from sideways action, a higher low, and a recovery back above recent resistance. Without that, the risk remains that $BTC continues drifting lower inside the channel.
The chart gives a clear message: Bitcoin is approaching a major long-term support test. If the channel holds, it could set the stage for a larger reversal, but buyers still need to prove control.
Bitcoin Retests $58K Demand Zone as Bulls Watch for Reversal
Bitcoin is retesting the $58,000 to $62,000 demand zone, an area that previously helped trigger a major rally.
The weekly chart shows $BTC pulling back into the same horizontal range that acted as resistance in 2021 and later turned into support during the 2024 breakout. That makes the zone important for traders watching whether old resistance can continue to act as new support.
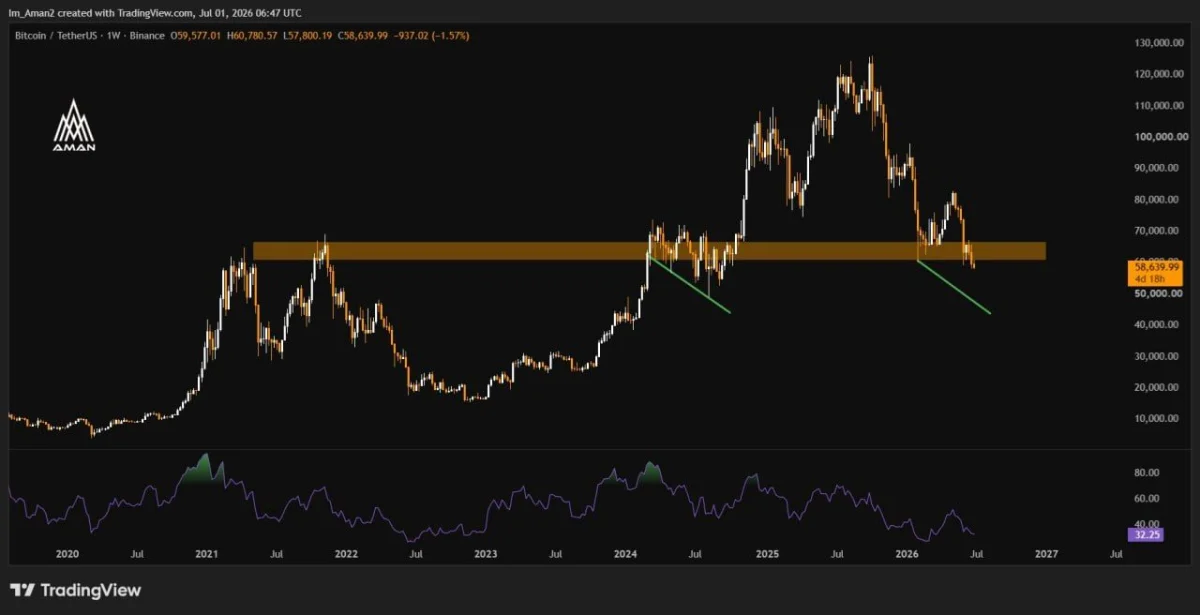
$BTC/$USDT weekly chart. Source: Aman on X, TradingView.
The chart also compares the current setup with a previous pullback. In both cases, Bitcoin moved into the same demand area while the broader structure stayed above a rising support line.
That matters because a successful defense of the $58,000 to $62,000 zone could give bulls a base for another recovery attempt. The first sign of strength would be a weekly close back above the demand area, followed by a move toward the next resistance near $70,000.
The RSI is also sitting near the lower part of its range, showing weak momentum. However, if price holds support while RSI starts turning higher, it could support the case for a reversal.
The risk is a clean breakdown below the demand zone. If $BTC loses the $58,000 area and fails to reclaim it, the chart would look weaker and could open the door to a deeper move toward lower support.
For now, Bitcoin is at a key support test. Holding the $58,000 to $62,000 zone could keep the bullish reversal setup alive, but buyers still need to show strength.