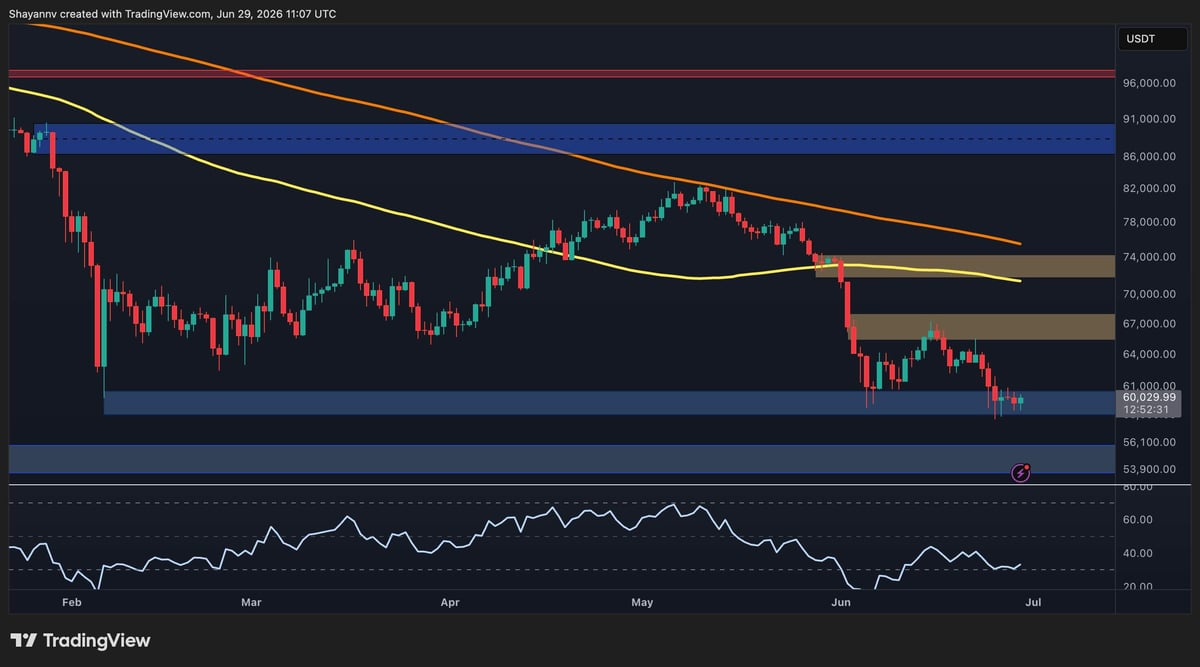
However, the broader trend remains bearish. The 100-day and 200-day moving averages are both sloping downward, with the 200-day MA positioned around the $75k area and continuing to act as the ultimate dynamic resistance. Meanwhile, the $67K zone represents the first significant resistance on any recovery attempt, followed by the stronger $74K supply region.
To the downside, a decisive daily close below the $60K support would likely expose the next major demand area around $54K and potentially extend the current corrective phase.
$BTC/USDT 4-Hour Chart
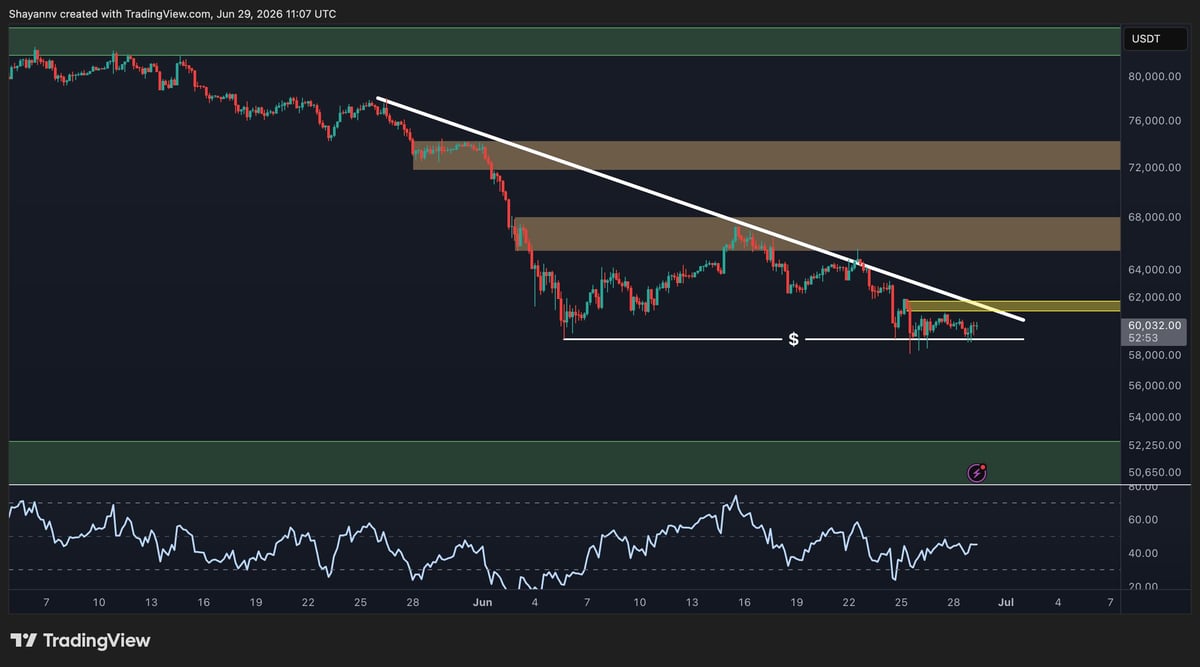
The 4-hour chart highlights a well-defined descending trendline that has consistently capped every recovery attempt since late May. The price recently tested this trendline again but failed to break above it, reinforcing bearish control over the short-term structure.
$BTC is now consolidating just above the horizontal support around $60K, forming a relatively tight trading range after the latest rejection. The RSI has also recovered from oversold conditions and is hovering near the midline, suggesting that downside momentum has cooled, although there is still no convincing bullish momentum shift.
The first hurdle for buyers remains the descending trendline, which is currently located just below the $61K to $62K resistance zone. A successful breakout above both levels could trigger a short-term recovery toward the $67K supply area.
On the other hand, losing the $60K support with a bearish candle closing below it would invalidate the current consolidation and likely accelerate selling toward the next daily demand zone near $54K.
On-Chain Analysis
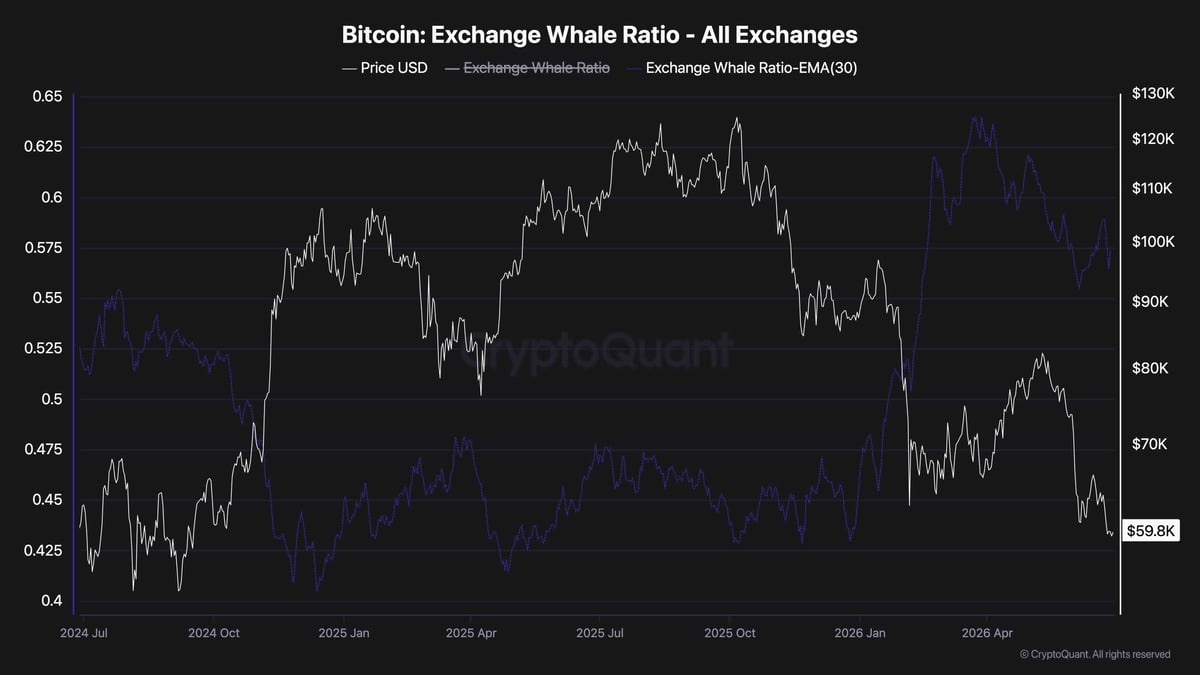
The Exchange Whale Ratio, which measures the proportion of the top exchange inflows relative to total inflows, has been trending lower alongside Bitcoin’s recent decline. Lower readings generally indicate that large holders are contributing a smaller share of exchange deposits, suggesting that aggressive whale selling has eased compared to previous periods.
While this moderation in whale activity may reduce immediate sell-side pressure, it does not yet signal a confirmed bullish reversal. Bitcoin continues to trade at a major technical support while the broader market structure remains bearish, indicating that buyers still need to reclaim key resistance levels before a sustained recovery becomes more likely.
For now, the combination of stabilizing whale inflows and price holding above the $60K support zone offers the first signs that selling pressure may be cooling. Nevertheless, confirmation will require Bitcoin to break above the descending trendline on the 4-hour timeframe and reclaim the $67K area before sentiment can begin shifting in favor of the bulls.

 cryptopotato.com




