
Bitcoin ($BTC) hit new 21-month lows at Thursday’s Wall Street open as high US inflation unsettled stock markets.
Key points:
- Bitcoin returns to its lowest level since September 2024, dropping to $58,000.
- US PCE inflation rocks equities, with the Nasdaq 100 shedding 2% in just 30 minutes.
- $BTC's correction mirrors the price action seen throughout the 2022 bear market.
Crypto liquidations pass $600 million in an hour as $BTC price drops
Data from TradingView showed $BTC/USD dropping to $58,035 on Bitstamp — a level it last traded at in September 2024.
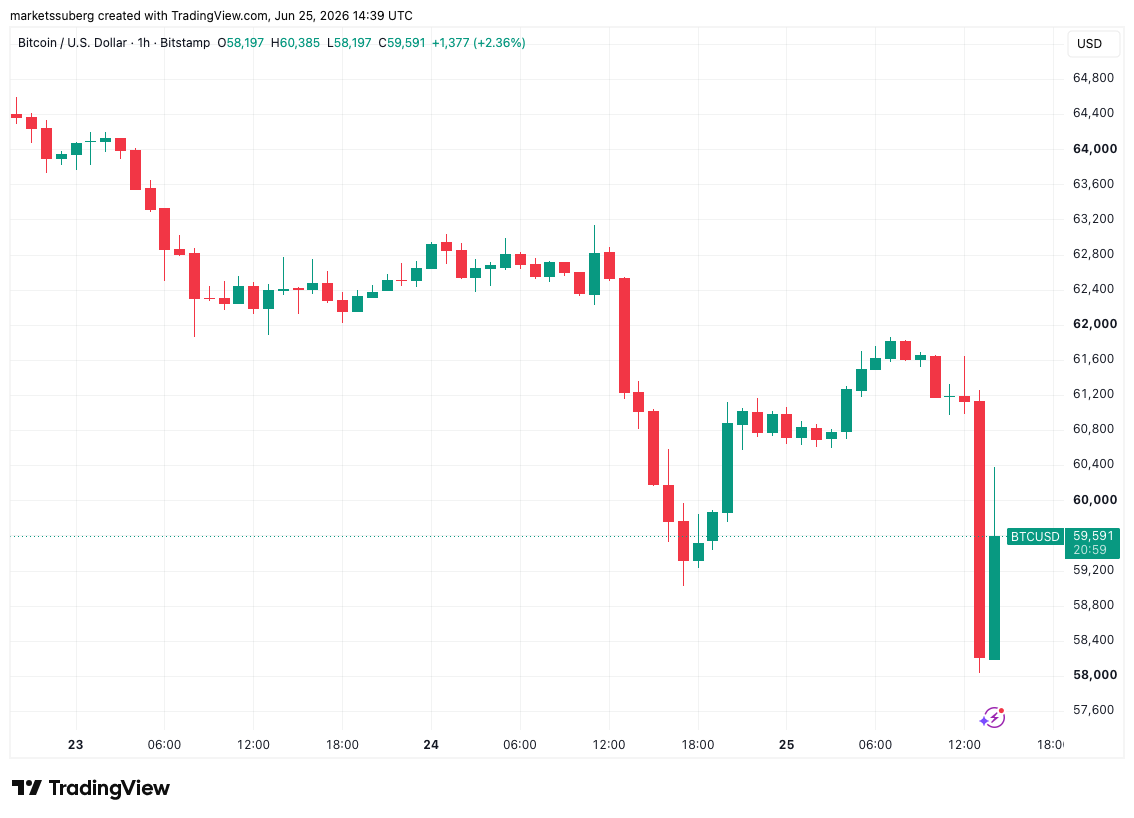
$BTC/USD one-hour chart. Source: Cointelegraph/TradingView
The May print of the US Personal Consumption Expenditures (PCE) index came in at 4.1%, setting a new three-year record.
“From the preceding month, the PCE price index for May increased 0.4 percent. Excluding food and energy, the PCE price index increased 0.3 percent,” a data release from the Bureau of Economic Analysis (BEA) stated.
“From the same month one year ago, the PCE price index for May increased 4.1 percent. Excluding food and energy, the PCE price index increased 3.4 percent from one year ago.”
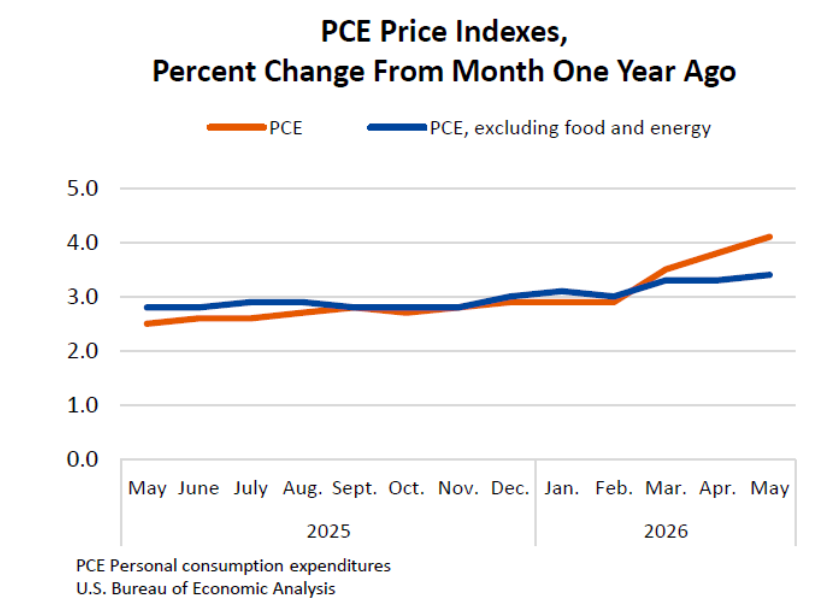
US PCE one-month % change (screenshot). Source: BEA
Stocks reacted with volatility, with the Nasdaq Composite Index down 0.5% at the time of writing, while the S&P 500 managed to eke out a gain.
The Nasdaq 100, meanwhile, saw a larger snap decline of 2% in just 30 minutes at the open.
“What a chart,” trading resource The Kobeissi Letter responded on X.
Bitcoin itself sparked considerable long position liquidations, with CoinGlass putting the cross-crypto liquidation total at $600 million over a single hour.
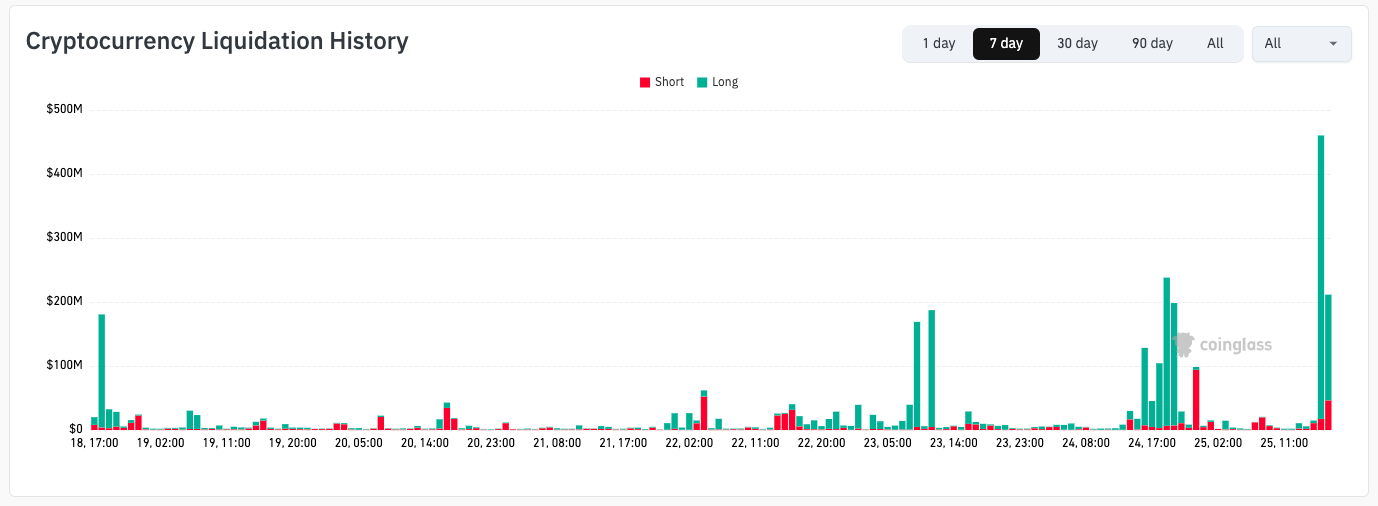
Crypto liquidation history (screenshot). Source: CoinGlass
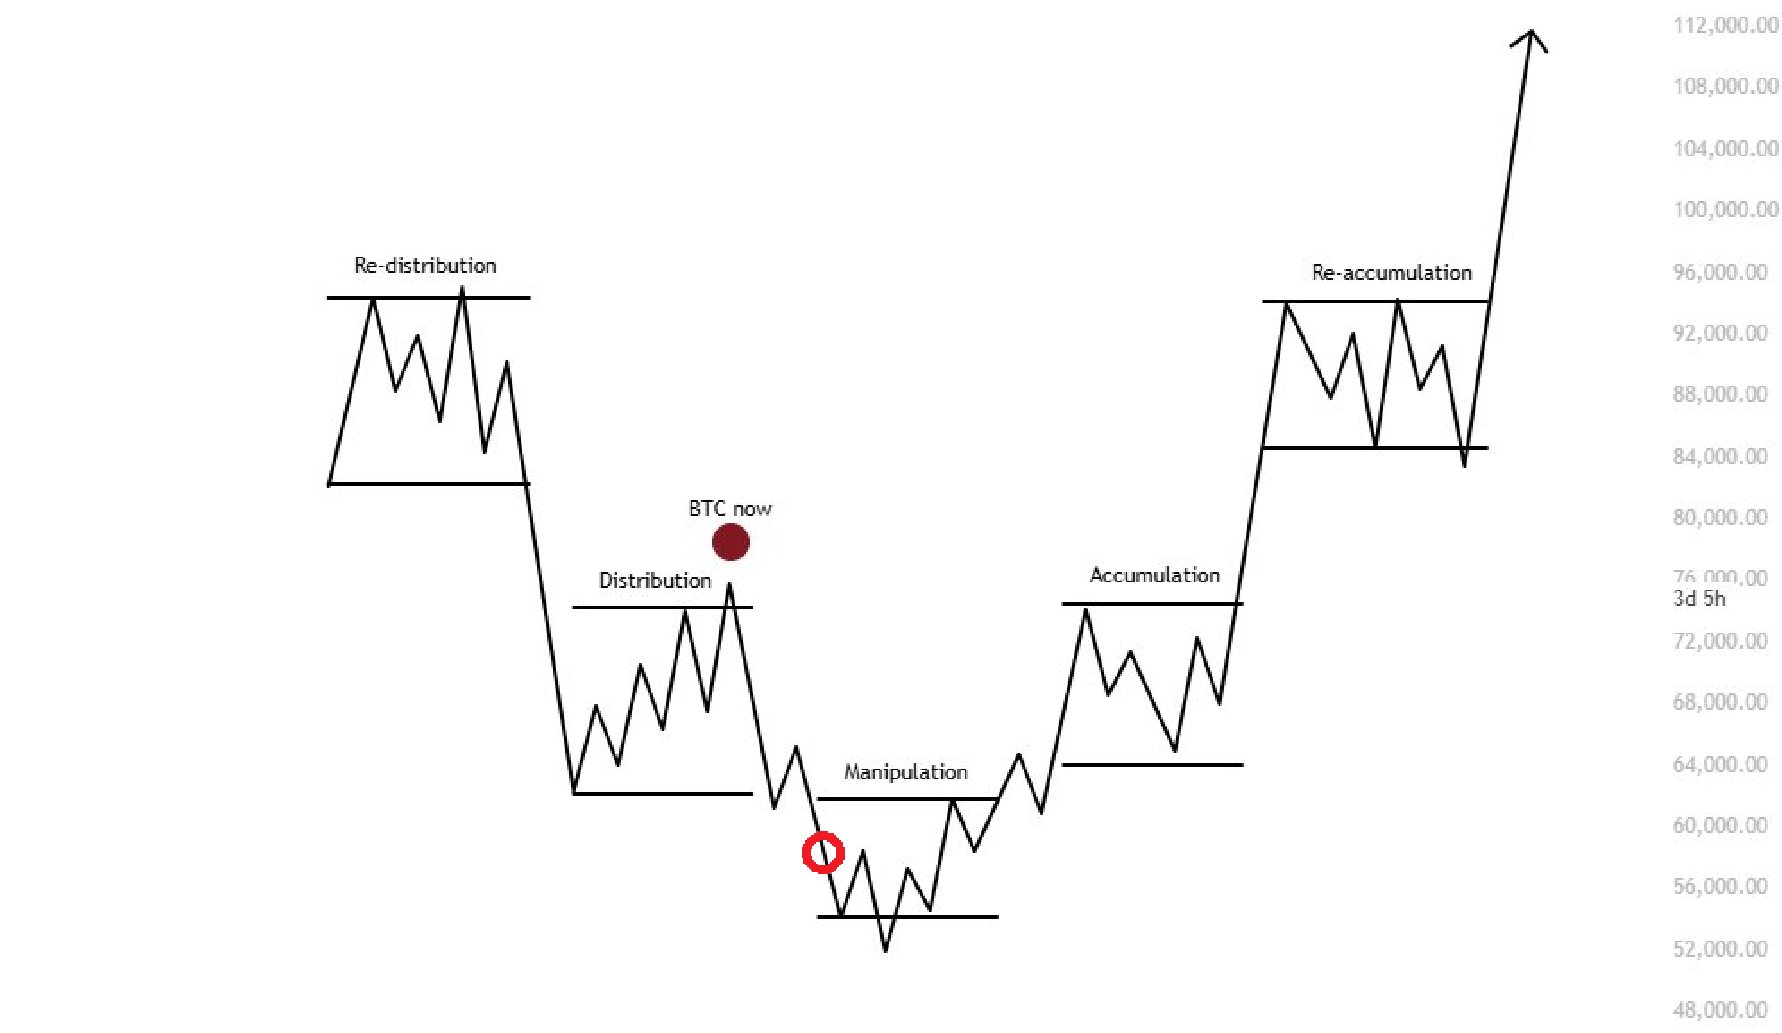
Commenting, market participants suggested that price moves were being artificially managed to squeeze positions.
“$BTC is in the manipulation phase,” pseudonymous trader Killa told X followers.
“Every time $BTC trades sub-$60K, that is our manipulation beneath the significant $60K swing low on the weekly and quarterly. Precisely the reason why the orderbook is stacked below us.”
Source: Killa/X
Niels Klaver, cofounder of crypto platform STABL Agency, suggested that $BTC/USD “seems to be going for its final leg down of this bear market.”
“$55K remains the target,” he added, referring to an increasingly popular short-term price goal.
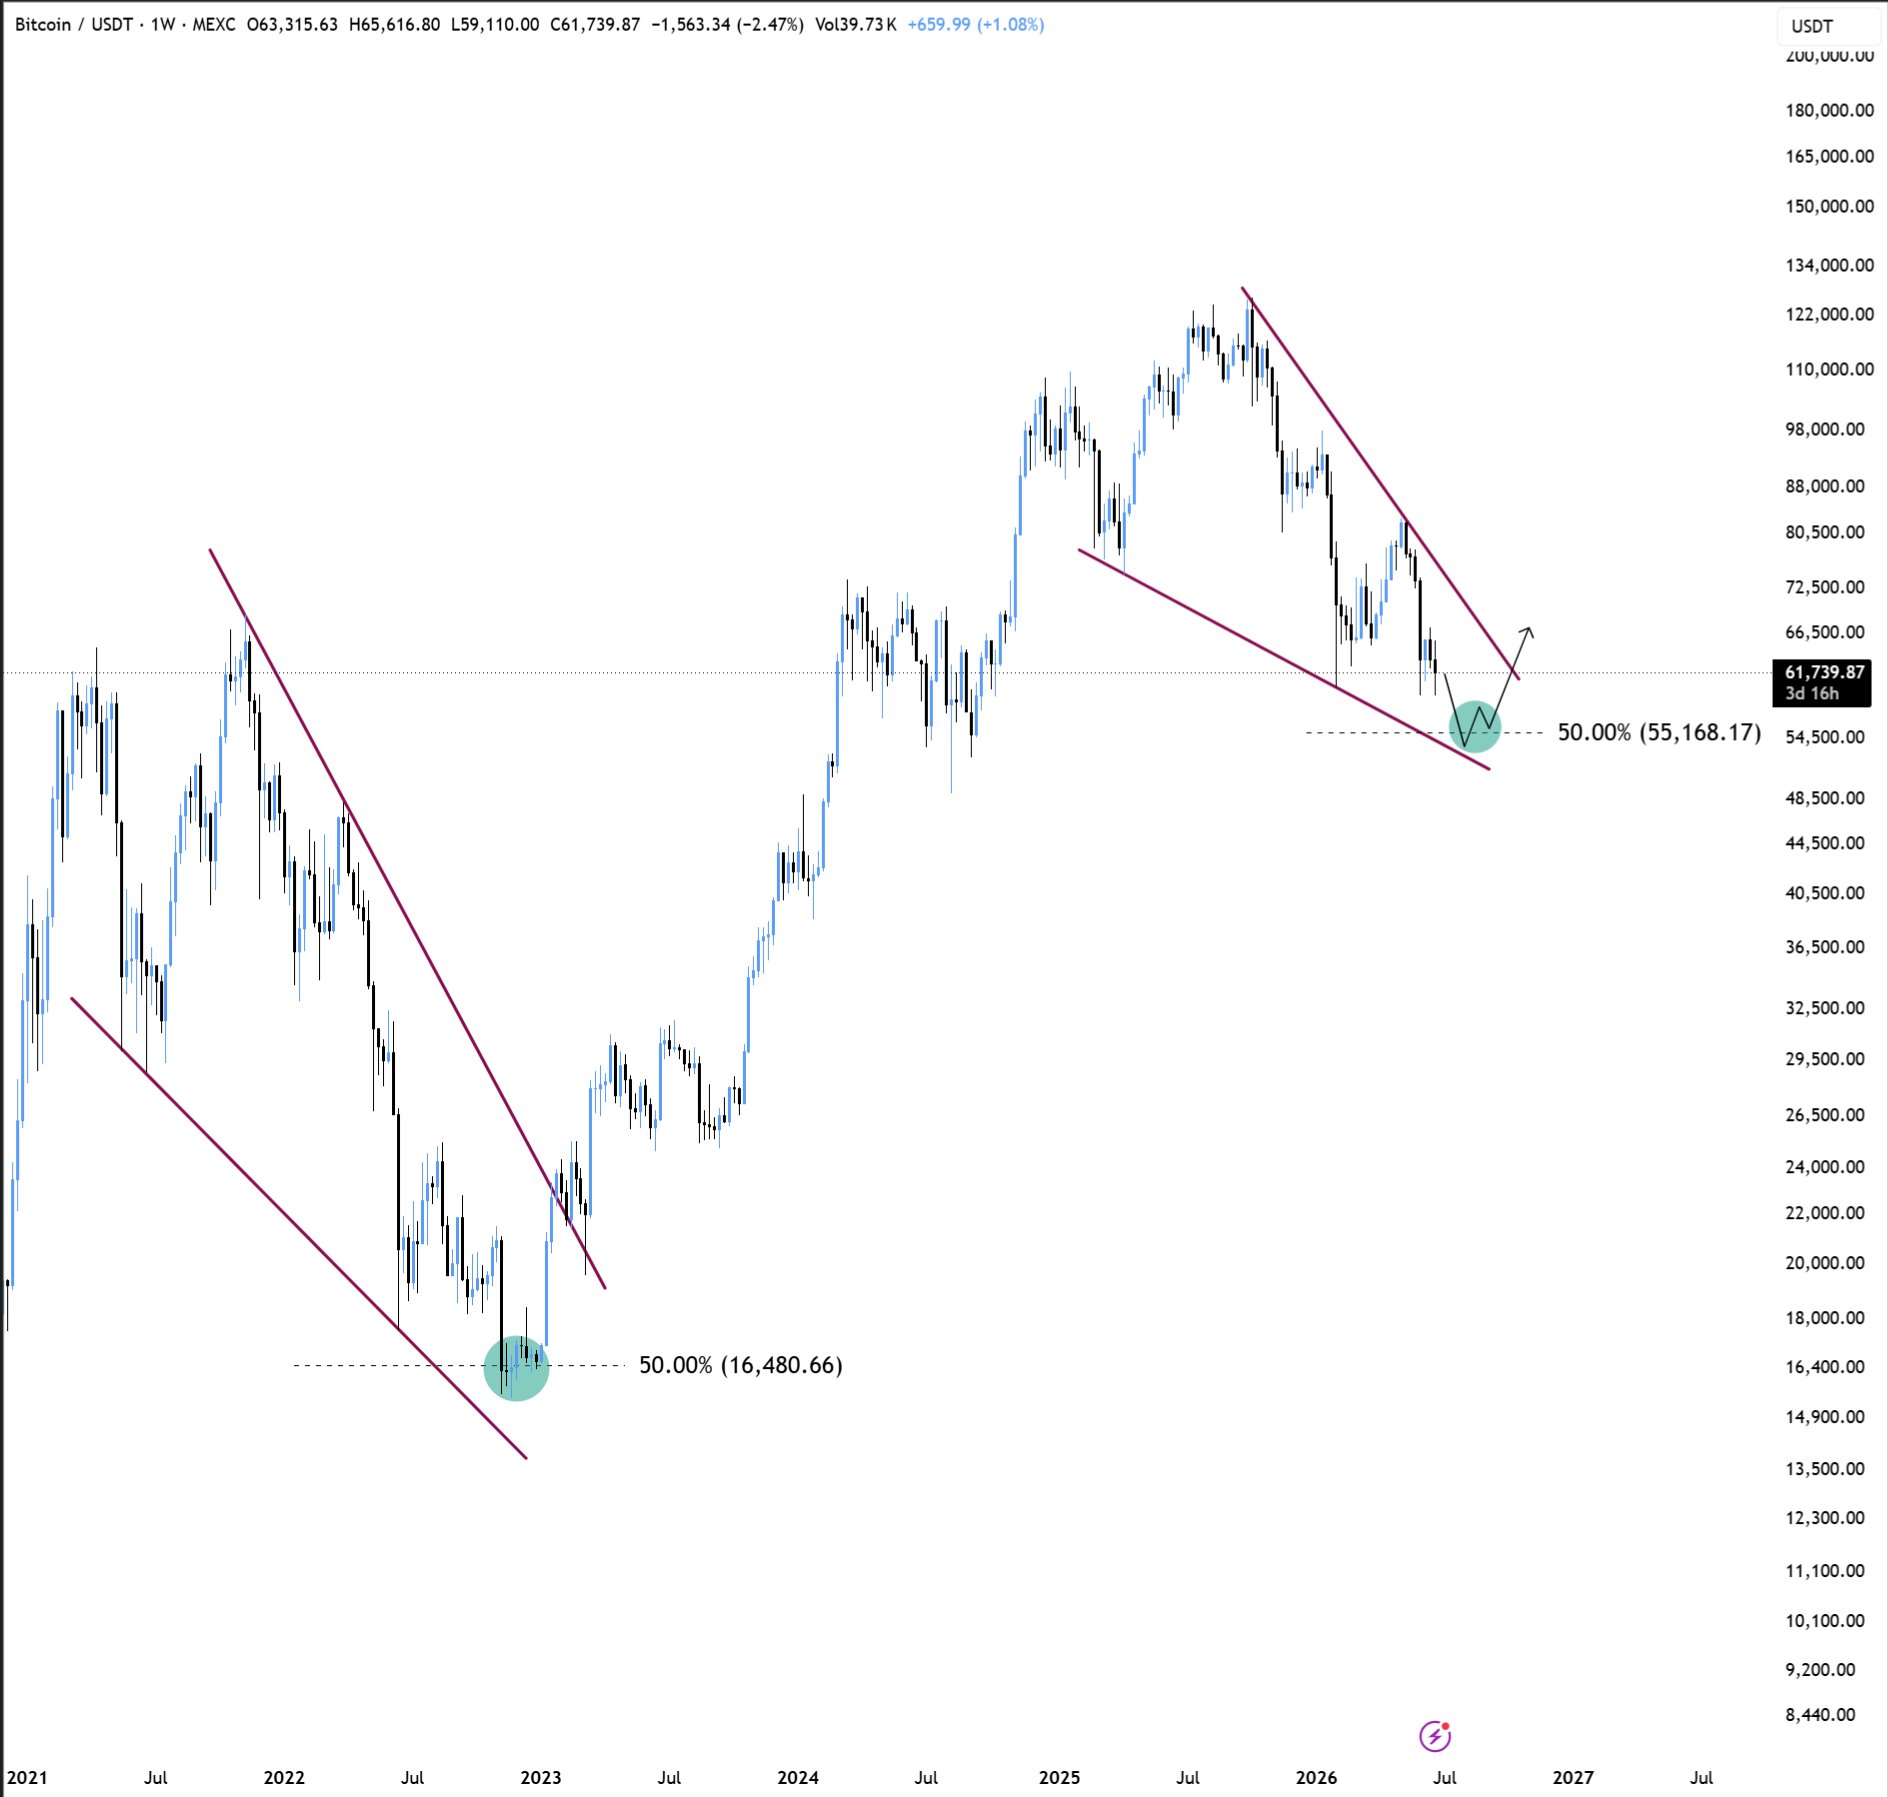
$BTC/USDT one-week chart. Source: Niels Klaver/X
Bitcoin analysis sees new resistance near $65,000
As $BTC price action attempted a modest rebound, trader and analyst Rekt Capital had already described $60,000 support as “clearly weakening.”
Related: $BTC price four-year trend calls for $76K as analysis says Bitcoin 'not broken'
“Once June Monthly Closes, we'll know from which price July will be able to potentially spring into a post-breakdown relief rally,” an X post read.
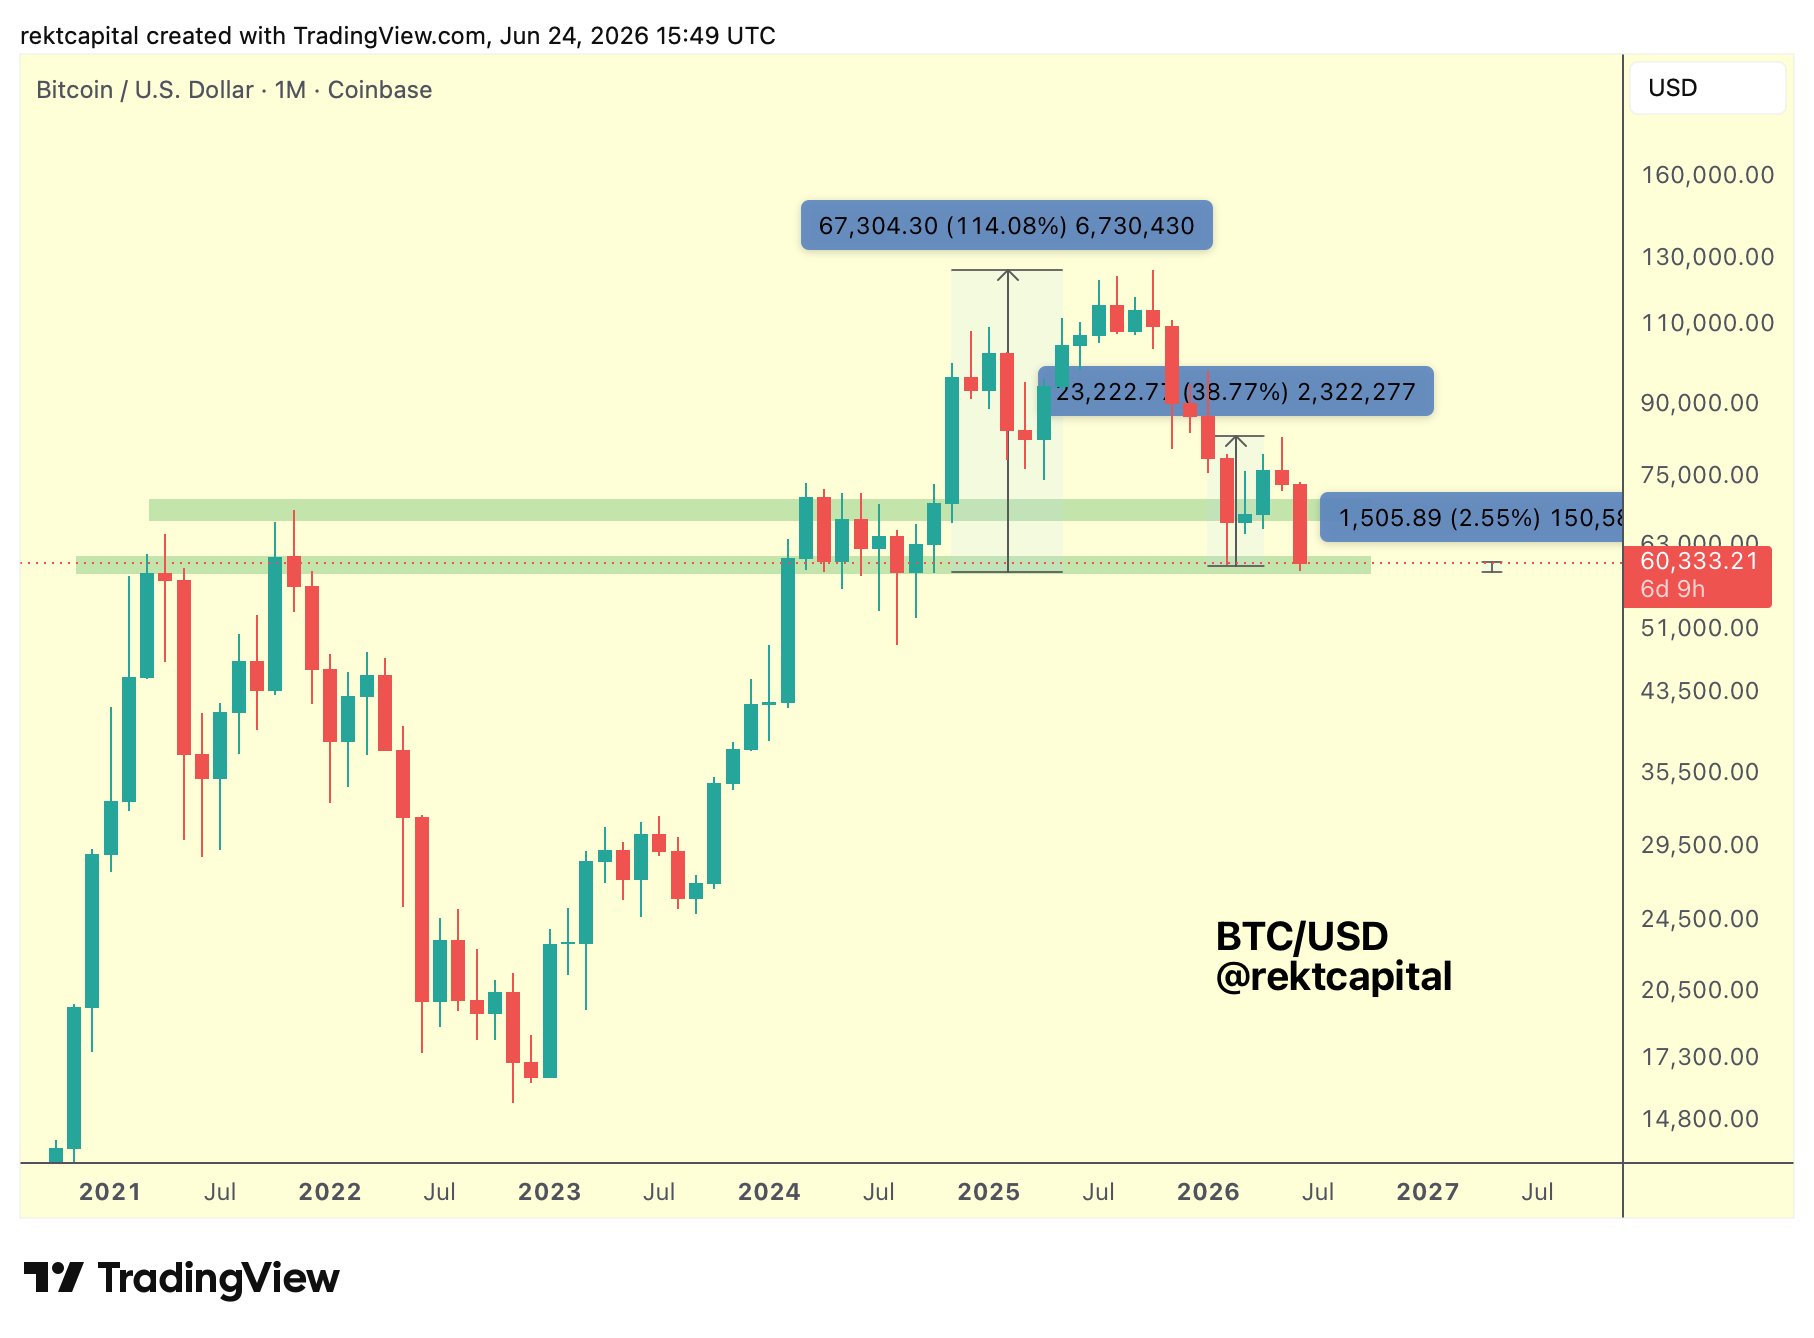
$BTC/USD one-month chart. Source: Rekt Capital/X
Rekt Capital maintained that the market was acting similarly to 2022, with the 50-month exponential moving average (EMA) tipped to become new resistance next.
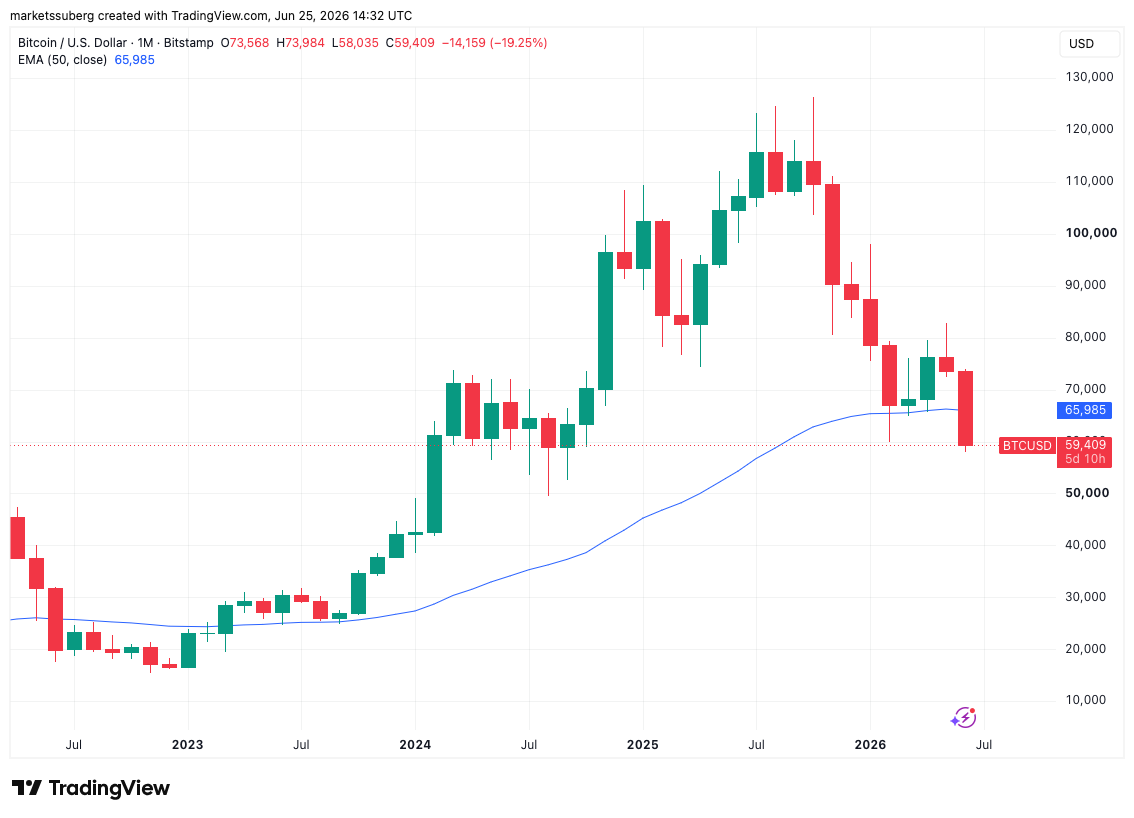
$BTC/USD one-month chart. with 50EMA. Source: Cointelegraph/TradingView