
Bitcoin buyers are defending the $59,000–$60,000 support zone, but the rebound still needs confirmation. A move above $62,400 and then $65,000 could trigger an upside squeeze, while losing $59,000 would reopen the risk of deeper losses.
Bitcoin Buyers Defend $59K as Bulls Eye an Upside Squeeze
Bitcoin has produced a strong lower wick after briefly falling through several major support levels, showing that buyers stepped in near the $59,000–$60,000 area.
The daily chart shows $BTC trading near $60,870 after sweeping below the February low, the monthly 50-period simple moving average near $59,305 and the long-term rising trendline. Price later recovered above the deeper support levels, forming a higher closing low despite the sharp intraday drop.
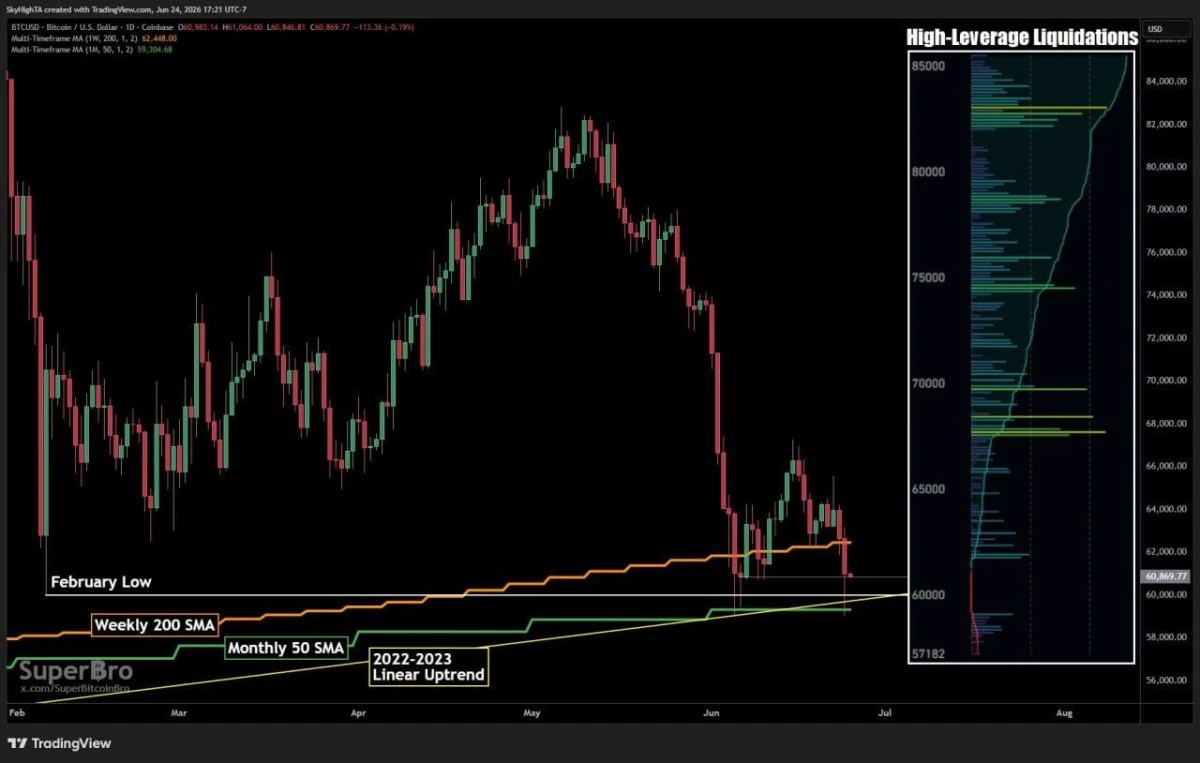
$BTC/USD Daily Support and Liquidation Chart. Source: Super฿ro (@SuperBitcoinBro) on X
However, the rebound has not yet confirmed a bullish reversal. Bitcoin remains below the weekly 200-period moving average near $62,448, which now represents the first major level buyers need to reclaim.
The liquidation map also shows large clusters of high-leverage positions above the current price, particularly around $67,000–$69,000, $74,000 and $78,000. A sustained recovery could force short liquidations and add momentum to an upside move.
The timing also matters because Bitcoin is approaching the end of the second quarter. Holding the $59,000–$60,000 support area and reclaiming $62,400 could support a stronger quarterly close. In contrast, continued weakness below the monthly moving average and rising trendline would increase the risk of further losses during the third quarter.
For now, the lower wick shows demand, but bulls still need to follow through. The key levels are approximately $59,300 as support and $62,400 as the first major resistance.
Bitcoin Tests $60K Again as Bulls Target a Major Recovery
Bitcoin is testing the $60,000 support level for the third time, while traders watch whether buyers can turn the repeated defense into a broader recovery.
The three-day chart shows $BTC trading near $60,800 after returning to the same area that supported price in February and earlier in June. Each previous test produced a rebound, suggesting that buyers continue to view the $60,000 zone as an important entry area.
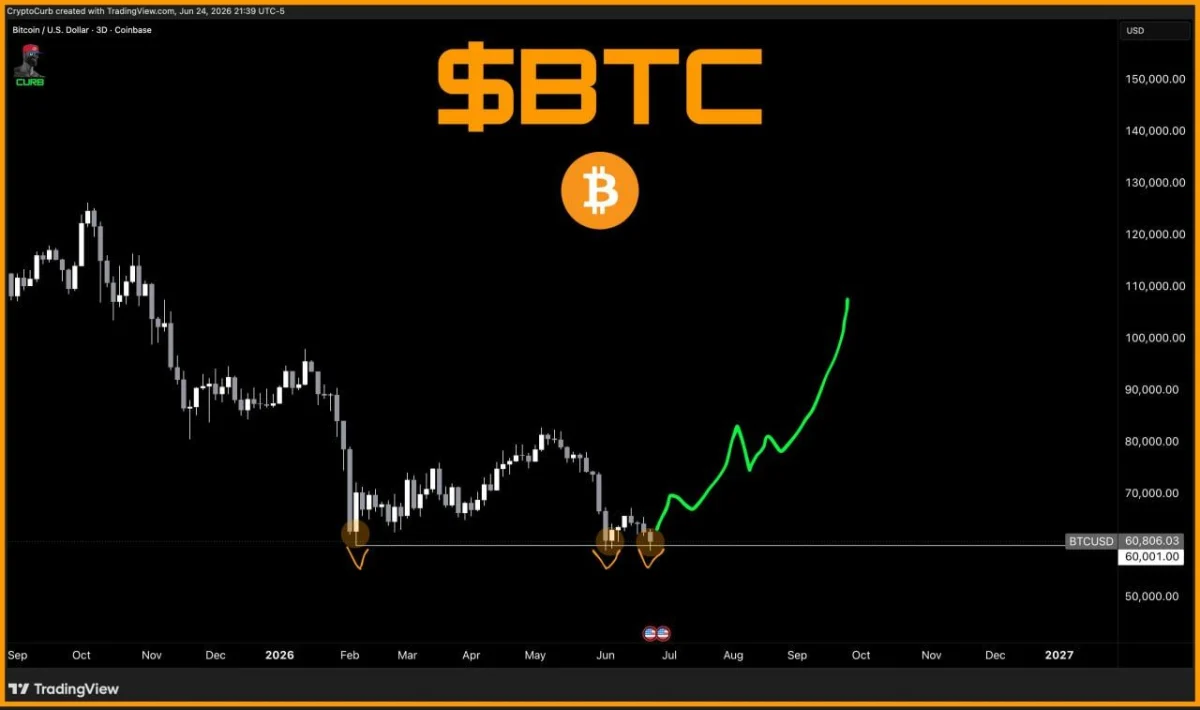
$BTC/USD Three-Day Support and Recovery Chart. Source: CryptoCurb (@CryptoCurb) on X
However, holding support alone would not confirm a bullish reversal. According to CryptoCurb, Bitcoin must also recover above $65,000 to strengthen the setup and show that buyers are regaining control.
The projected path on the chart suggests that a successful breakout could first take $BTC toward $70,000, followed by resistance around $80,000. The longer-term projection extends above $100,000, but this remains a possible scenario rather than a confirmed target.
A decisive break below $60,000 would weaken the repeated-bottom structure and invalidate the immediate bullish outlook. For now, $60,000 remains the key support, while $65,000 is the level bulls need to reclaim.