
Bitcoin is flashing conflicting signals, with a short-term breakdown pointing toward $57,500 while long-term support suggests a bottom may be forming. The next major move could decide whether $BTC enters a deeper correction or starts a recovery toward $71,000.
Bitcoin Head-and-Shoulders Breakdown Targets $57.5K
Bitcoin has broken below the neckline of a four-hour head-and-shoulders pattern, putting the projected downside target near $57,500 in focus.
The chart shows $BTC trading around $62,150 after losing both the rising neckline near $63,000 and the weekly 200-period moving average around $62,450. This breakdown strengthens the bearish setup, although Bitcoin still has another major support level near the monthly 50-period moving average at approximately $59,330.
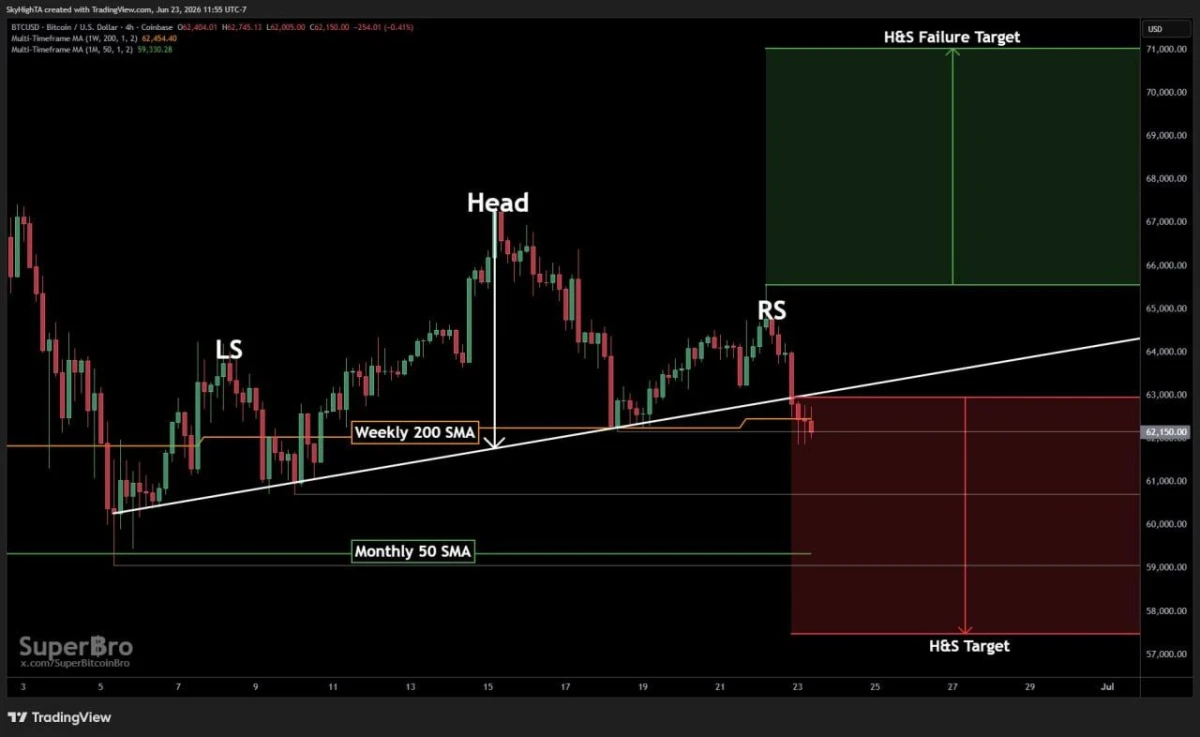
$BTC/USD 4-Hour Head-and-Shoulders Chart. Source: Super฿ro (@SuperBitcoinBro) on X
A move toward $57,500 would push $BTC below that higher-time-frame support and could result in a weak second-quarter close. According to Super฿ro, that outcome may also leave Bitcoin exposed to further downside during the third quarter.
However, the bearish scenario could fail if buyers reclaim the neckline and push $BTC above the right-shoulder area. The chart places the head-and-shoulders failure target near $71,000. Reaching that level would strongly suggest that Bitcoin has already established a local bottom.
For now, $59,300 is the main support standing between $BTC and the $57,500 target, while a recovery above roughly $65,500 would begin weakening the bearish structure.
Bitcoin Returns to Historical Support as Bulls Eye a Breakout
Bitcoin is trading near the lower boundary of its long-term regression channel, an area that has previously aligned with major market bottoms.
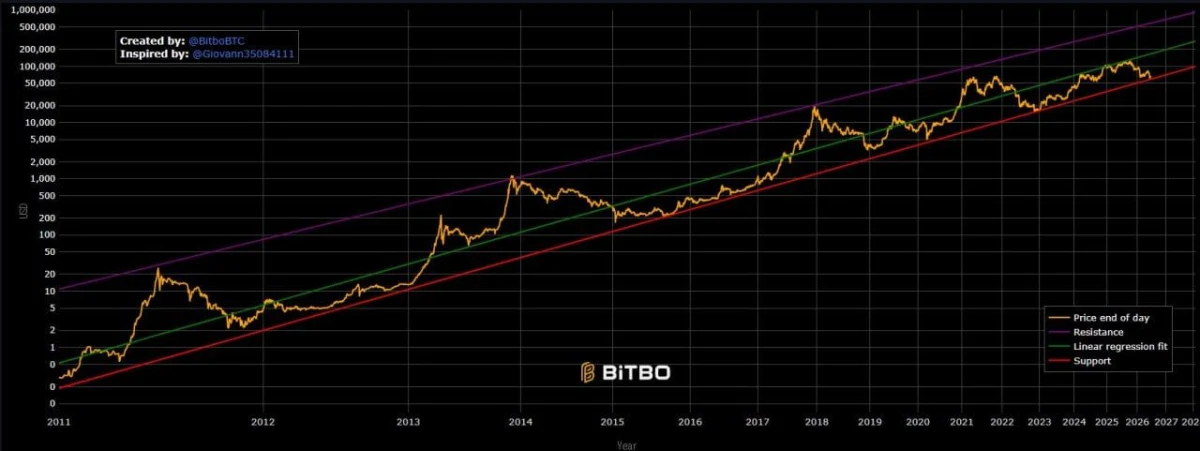
Bitcoin Long-Term Linear Regression Channel. Source: Bitbo, shared by CW (@CW8900) on X
The chart tracks $BTC’s price within three long-term levels: the red support line, the green linear regression fit and the purple resistance line. Bitcoin remains below the green regression line, suggesting that the market has not yet confirmed a strong bullish expansion.
According to analyst CW, previous major rallies gained momentum after $BTC reclaimed the linear regression fit. Bitcoin failed to hold above that level during the current cycle, leaving the market in a consolidation phase rather than a confirmed long-term uptrend.
However, continued support near the lower channel boundary could create a base for another recovery. A decisive move above the green regression line would strengthen the bullish case and could signal the beginning of a broader rally. Losing the red support line would weaken this outlook and raise the risk of a deeper correction.
The analyst also points to continued whale accumulation as a potential source of future buying pressure, although the chart itself does not display accumulation data.