Bitcoin is still under heavy selling pressure after breaking below a significant rising channel that had been guiding the price action since February, and there seems to be little stopping the asset from dropping lower.
The latest rejection from a short-term resistance has accelerated downside momentum once again and is pushing $BTC back toward the key demand zone around $60K. Meanwhile, on-chain data suggest that long-term holders are realizing losses, reflecting a notable shift in market dynamics.
Bitcoin Price Analysis: The Daily Chart
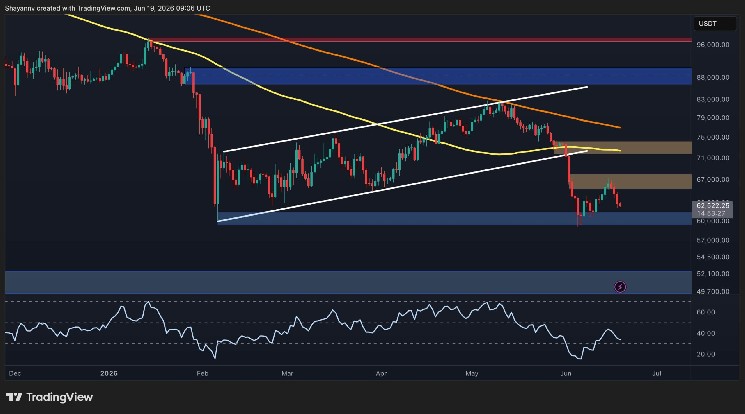
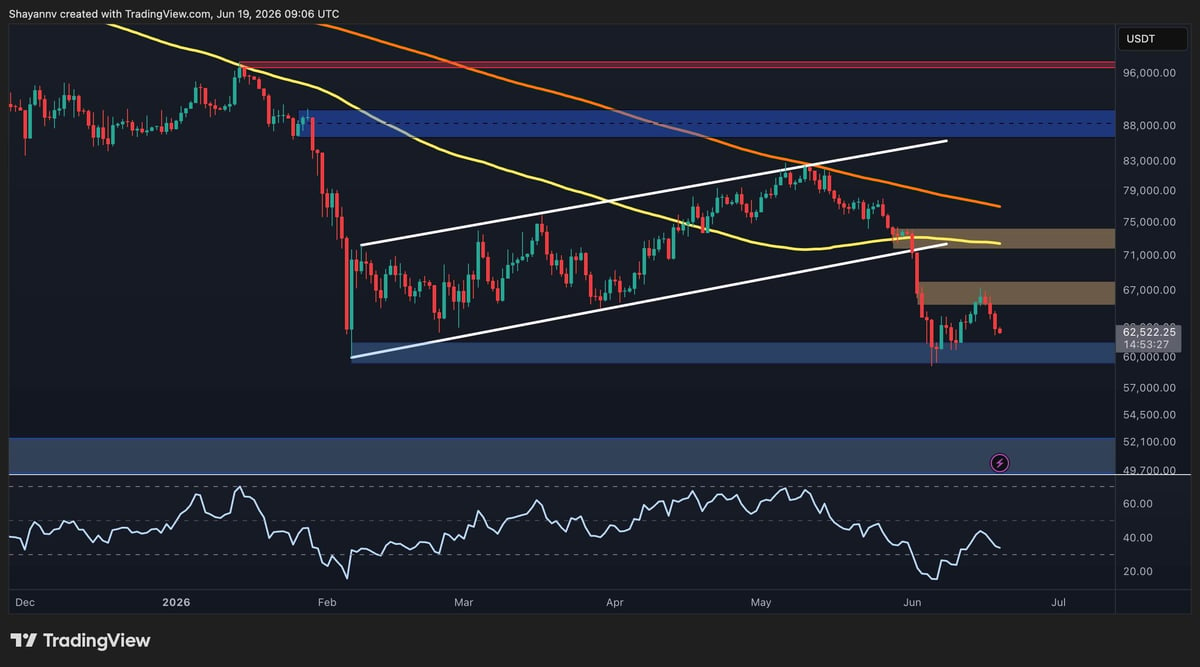
On the daily timeframe, Bitcoin has decisively broken below the large ascending channel that contained the price action for nearly four months. The breakdown occurred after $BTC failed to reclaim the confluence of the 200-day moving average and the $80k zone and was rejected decisively to the downside.
The 100-day moving average located near the $72k area has now formed a key resistance zone. The market attempted to retest it following the initial breakdown, but sellers quickly regained control and triggered another leg lower before the market even reached the area, as the price failed to break back above the $67k short-term supply zone. The rejection confirms that bears remain in control of the broader trend for now.
The asset is currently trading around $63k and is hovering just above a major support area at $60k. This key demand zone marks the most important level on the chart, as it previously acted as a launchpad for the February recovery following the sharp capitulation move.
As long as $BTC remains below the broken channel and beneath the moving averages, rallies are likely to be viewed as corrective. Moreover, should the $60k support region fail to hold, the next significant downside target appears to be the large demand area around $50k-$52k. Conversely, reclaiming the $72k resistance zone would be required to invalidate the current bearish outlook and potentially reopen the path toward the $80k region.
$BTC/USDT 4-Hour Chart
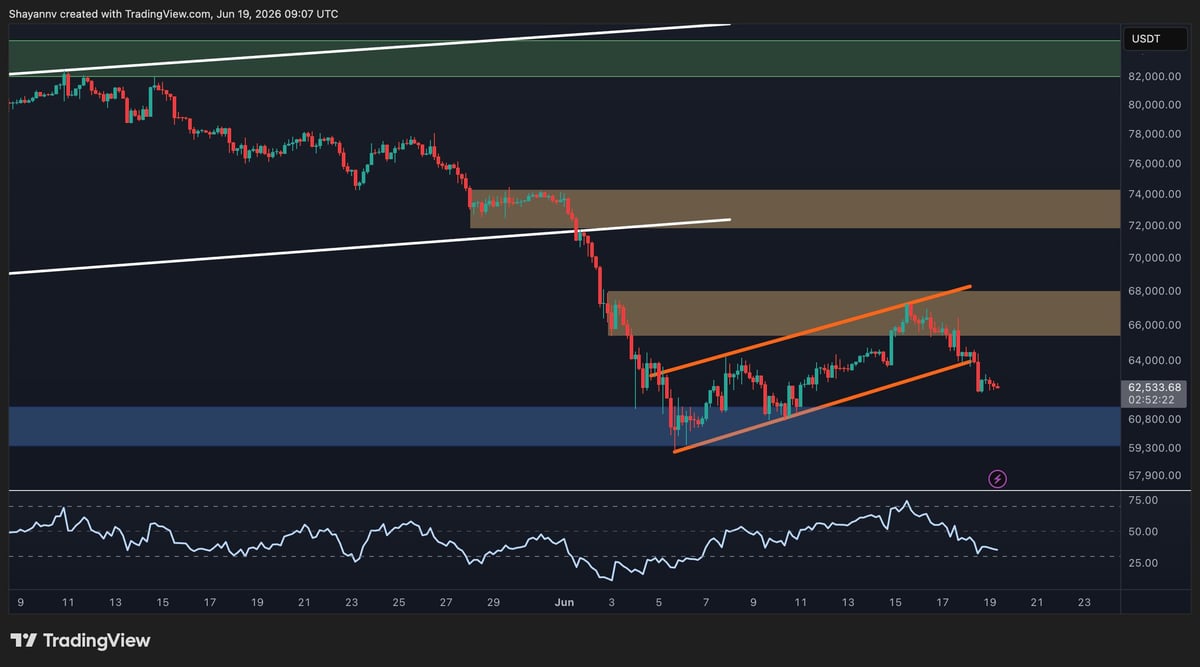
The 4-hour timeframe provides a clearer view of the recent breakdown. Following the breakdown from the $72k-$74k block, $BTC experienced an aggressive sell-off that drove the price into the $60k support zone. The subsequent rebound formed a short-term rising channel, which is often considered a bearish continuation pattern when it develops after a strong decline.
The price has recently broken below the lower boundary of the channel, confirming the bearish pattern and increasing the probability of another test of the $60k-$61k support area. The failed breakout attempt at $67k highlights the lack of bullish conviction. In addition, the RSI has rolled over from near-overbought conditions and is now trending lower near the oversold region, suggesting weakening short-term momentum.
If sellers maintain control, the immediate focus remains on the $60k support zone. A decisive breakdown could trigger another wave of liquidations and accelerate the move toward higher time-frame liquidity pockets beneath the recent lows.
On the upside, $BTC would need to recover the $67k resistance region before any meaningful bullish scenario can be considered. Above that, the next major barrier remains the $72k zone, which aligns with the broken daily support and moving-average cluster.
On-Chain Analysis
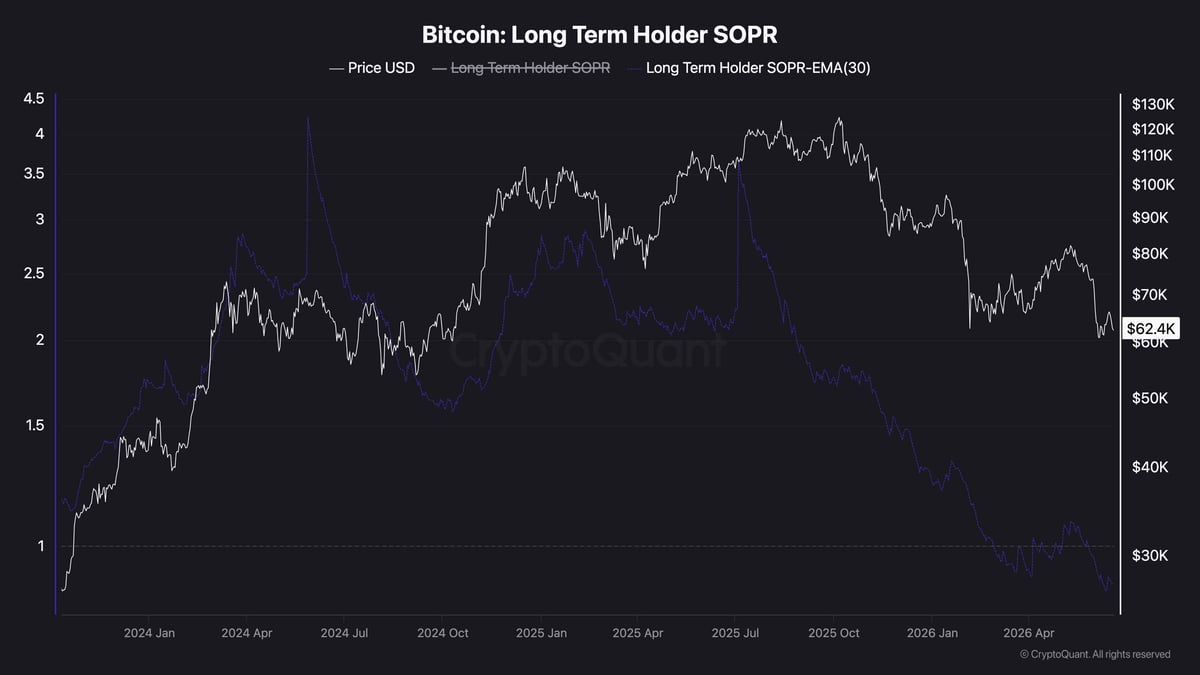
The Long-Term Holder SOPR (Spent Output Profit Ratio) continues to trend sharply lower and is now below the critical 1.0 threshold. This metric measures whether long-term holders are spending coins at a profit or a loss. Values above 1 indicate profitable spending, while readings near or below 1 suggest holders are either realizing minimal profits or refusing to distribute their coins.
The persistent decline in the 30-day EMA of the Long-Term Holder SOPR reflects a substantial reduction in profit-taking activity among experienced market participants. Historically, such conditions often emerge during prolonged corrections, as investors become less willing to sell after a significant drawdown.
The metric has recently reached capitulation territory, and its continued deterioration confirms the weakening market environment visible on the price charts. If SOPR remains below 1, it would signal that long-term holders are consistently realizing losses, which is a condition that has historically coincided with late-stage correction phases and important market inflection points.
For now, the combination of bearish market structure, resistance rejection, and weakening long-term holder profitability suggests that Bitcoin remains vulnerable to further downside pressure unless buyers can reclaim the $72k region and re-establish control of the broader trend.