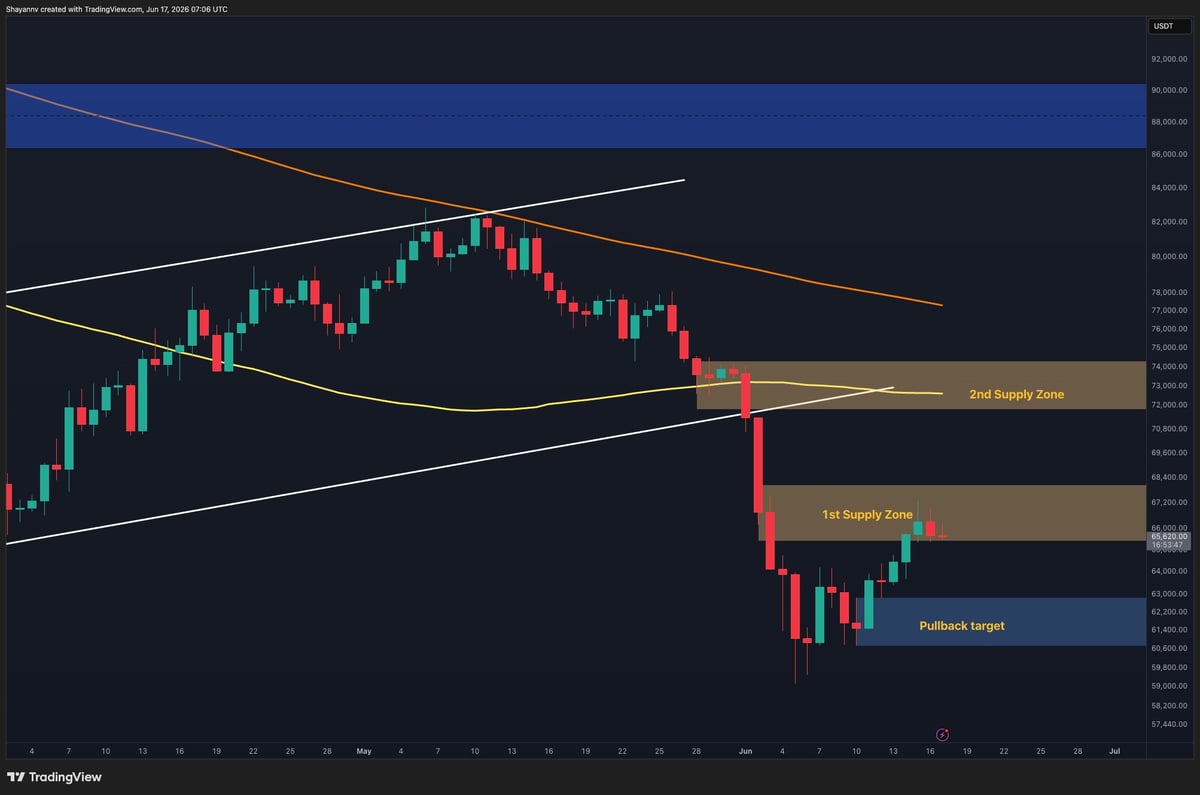
If buyers manage to reclaim the current supply zone, the next upside target would be the higher resistance region between $72K and $74K. This area aligns with the second supply zone, the 100-day moving average, and the lower boundary of the previously broken ascending channel, making it the next major hurdle for the market.
On the downside, the $60K-$62K area remains the key support zone. As long as $BTC holds above this region, the recent recovery structure remains intact.
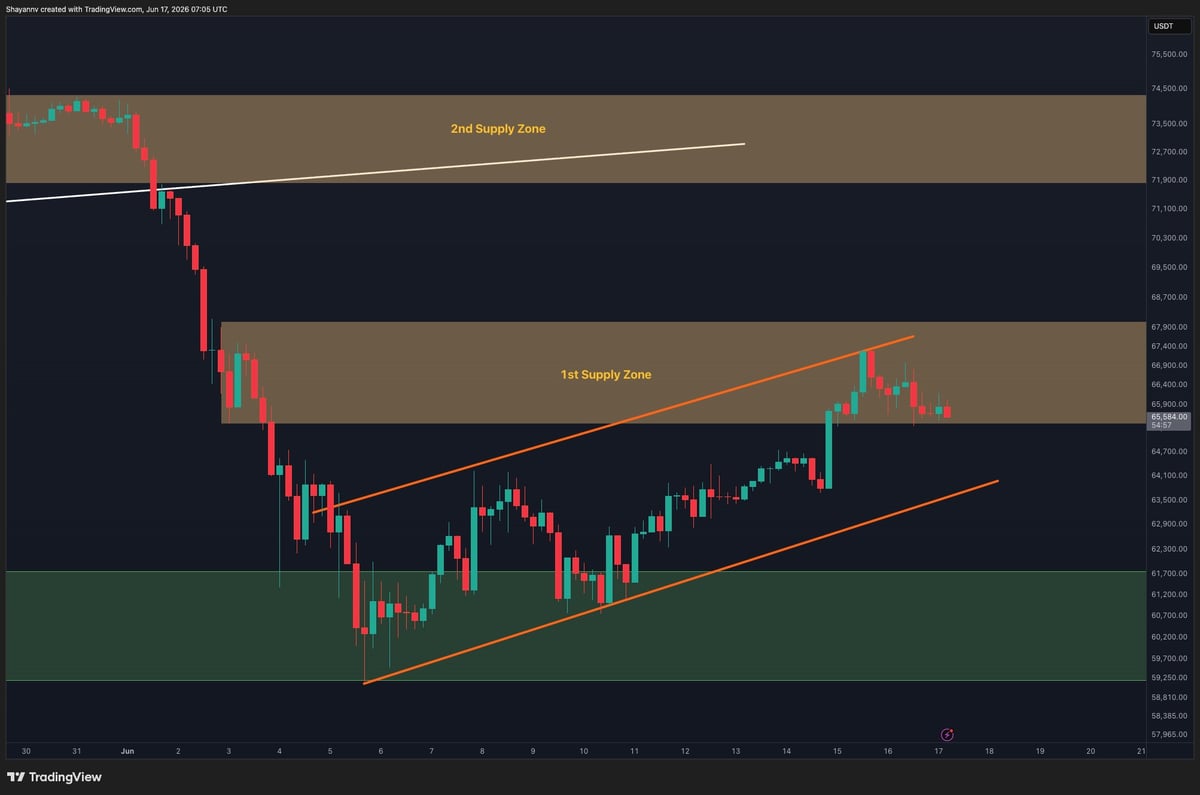
$BTC/USDT 4-Hour Chart
The 4-hour chart highlights the recent rally into the $65K to $67K supply zone following a breakout from the ascending recovery channel. After reaching the upper boundary of the zone near $66.8K, $BTC has entered a period of sideways consolidation.
The latest price action suggests that neither bulls nor bears currently have full control. The asset continues to hold above the former breakout region around $64K to $65K, while sellers have so far prevented a decisive move through the supply zone.
A breakout above $67K would strengthen the bullish case and could open the path toward the higher resistance area around $72K. Conversely, losing the $64K support region would likely trigger a deeper pullback toward the $61K to $62K demand zone.
For now, the short-term structure remains constructive as long as higher lows continue to develop above the recent breakout area.
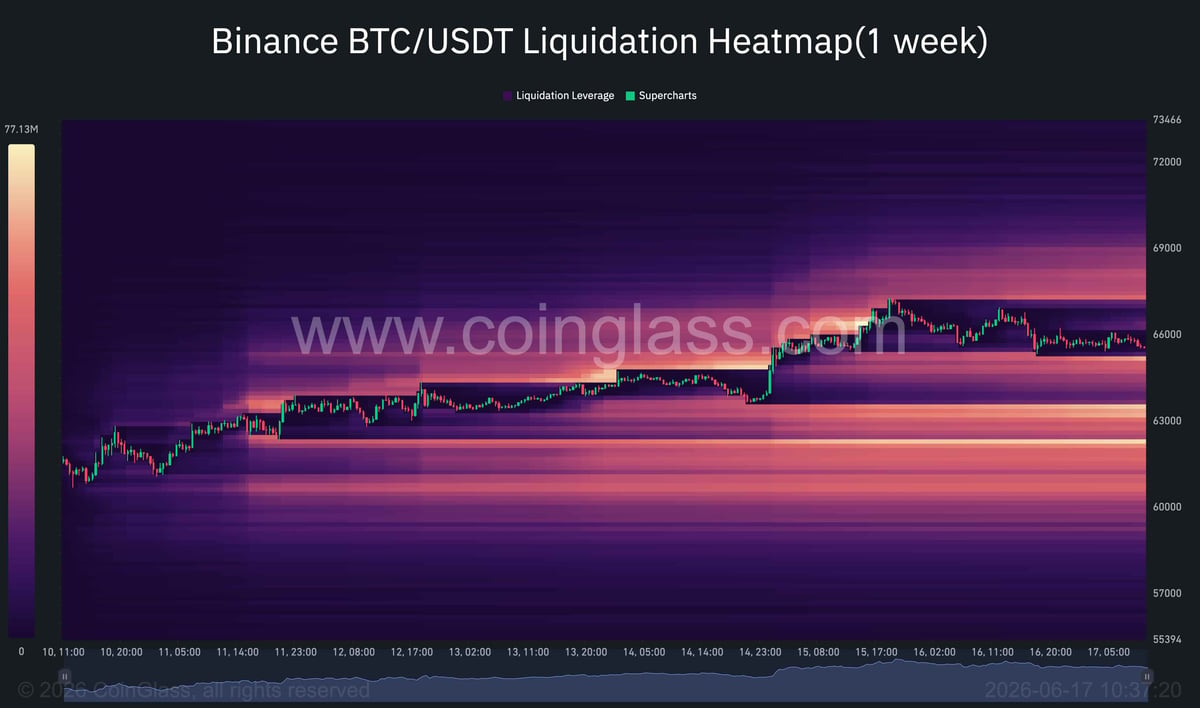
Sentiment Analysis
The Binance liquidation heatmap shows a notable concentration of liquidity both above and below the current price, but the nearest and most significant cluster is located between $67K and $69K.
Since $BTC is currently consolidating around $65K, this overhead liquidity zone could act as a short-term magnet. A push through the current supply region may trigger short liquidations and accelerate momentum toward the $68K to $69K area.
Meanwhile, a substantial liquidity pocket remains below the market, between $62K and $63K. Should $BTC lose the $64K support area, the market could be drawn lower to collect this liquidity before establishing the next directional move.
Overall, the heatmap suggests that the market is currently trapped between two major liquidity pools. Given the proximity of the upper cluster and $BTC’s ability to hold within the $65K to $67K resistance zone, the short-term bias remains slightly tilted toward an upside liquidity sweep into the $67K to $69K region before a larger directional decision emerges.

 cryptopotato.com




