
The Bitcoin CVDD model that has historically nailed the bottom now indicates that the premier crypto asset has a local base at $48,000.
Bitcoin ($BTC) dropped under $60,000 on June 5, breaking below its February low of $60,130. While its price has recovered to $65,000, the decline may have done more than shake market confidence.
According to on-chain data highlighted by CryptoQuant analyst Axel Adler Jr., the move pushed a key behavioral metric into a territory historically associated with capitulation phases. Additionally, a separate valuation model now points to $48,000 as the cycle’s possible price bottom.
The Bitcoin Drop to $60K Triggered a Rare On-Chain Signal
Adler highlighted that one of the most notable developments during the early June decline was the behavior of Bitcoin’s Adjusted Sell-side Risk Ratio (SSRR). The metric slipped into its red zone for the first time since the previous market cycle.
Notably, the metric compares the value of Bitcoin supply in profit and underwater against realized capitalization. The red zone indicates that the value of coins sitting at a loss has caught up with and is beginning to exceed the value of coins sitting at a profit.
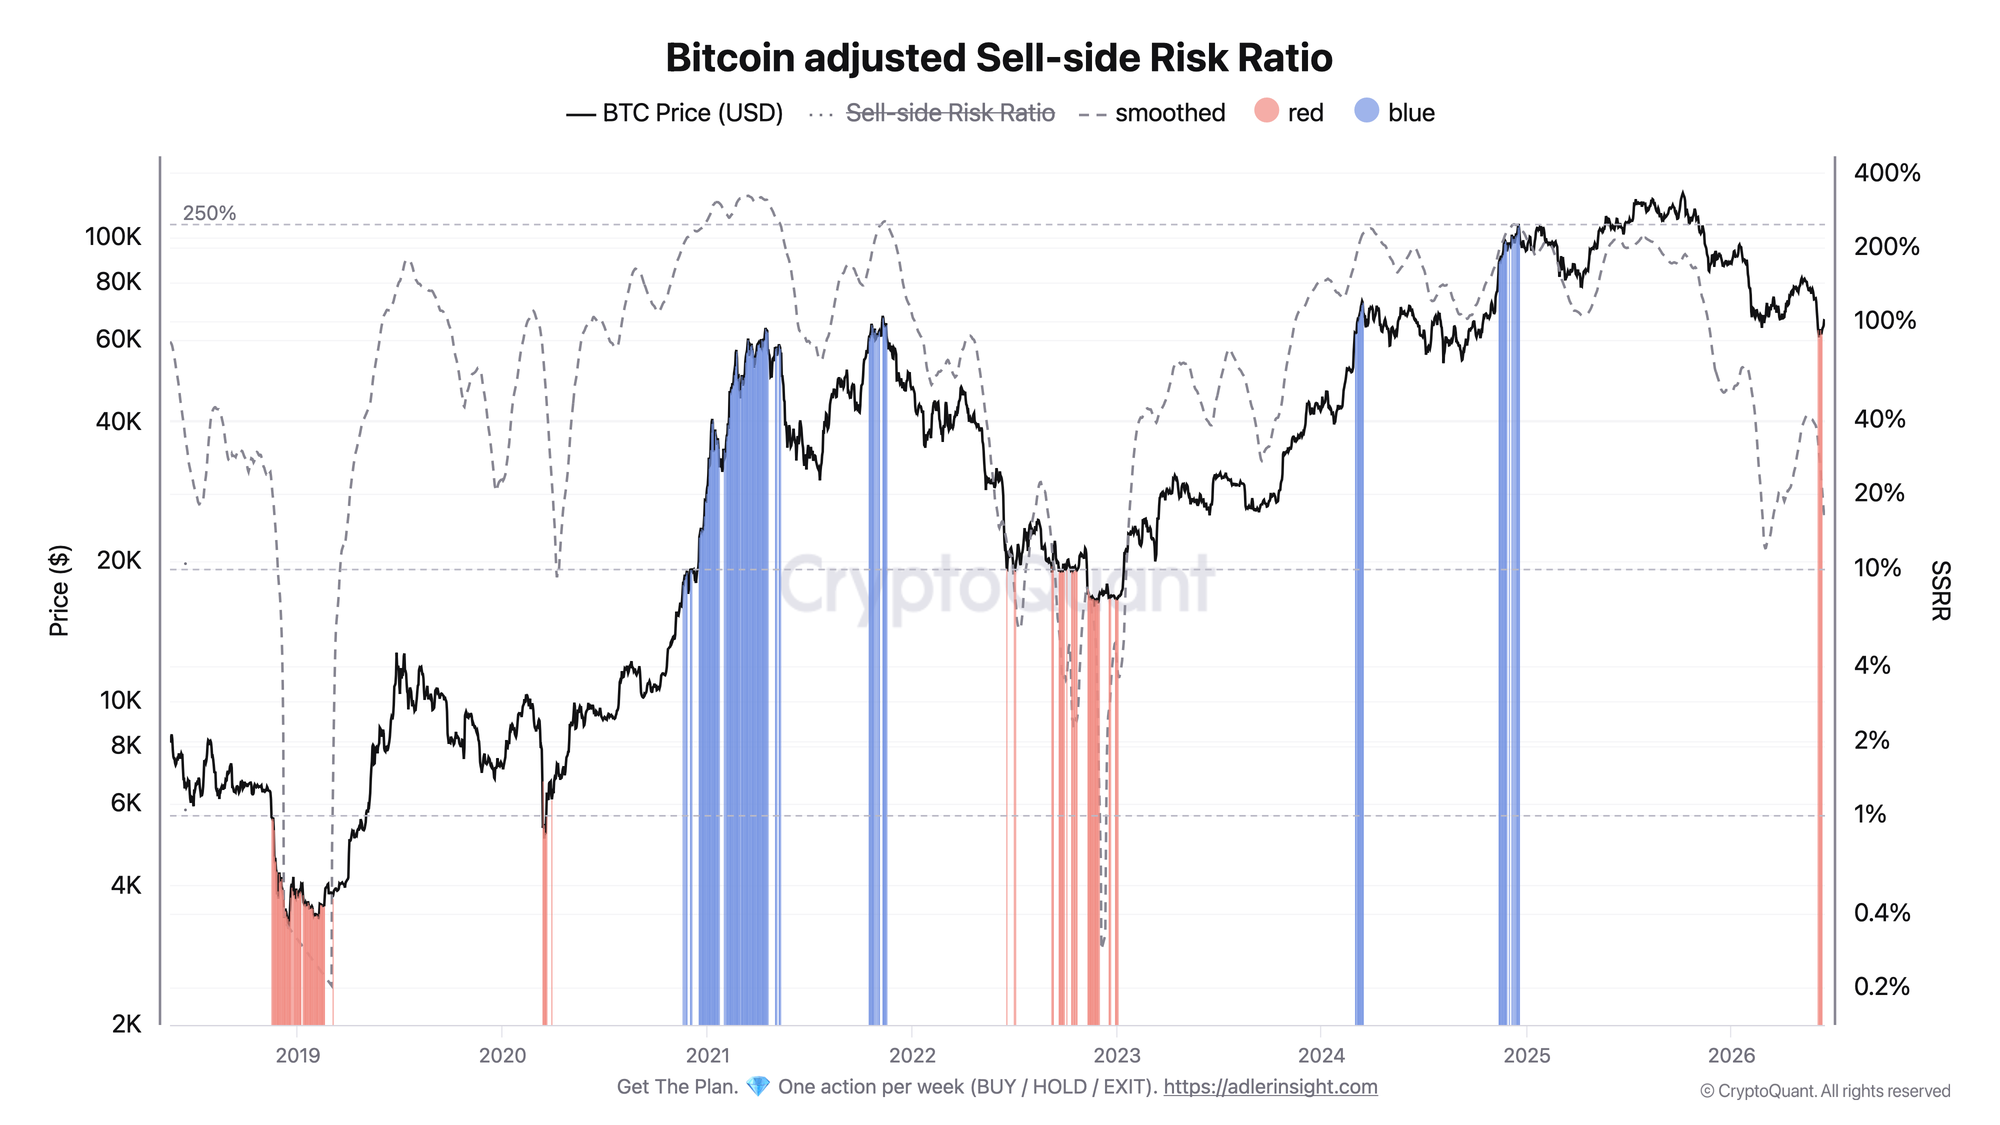
The development matters because it reflects growing stress among holders. Adler also linked this event to local capitulation phases and subsequent bottom formation, citing historical context. He noted that comparable conditions occurred in 2019 and 2023, both of which eventually gave way to broader recoveries.
While the SSRR printing red bars does not confirm a bottom, it does suggest that $BTC has moved from a phase dominated by optimism into one characterized by significant unrealized losses and heightened caution, historically linked with local base formations.
The Bitcoin CVDD Model Continues to Point Toward $48K
Adler’s analysis also featured the Cumulative Value Days Destroyed (CVDD) model, which approaches Bitcoin from a valuation perspective.
The model incorporates both the value and age of coins that move on-chain, creating what analysts view as a long-term estimate of Bitcoin’s fundamental floor. Throughout Bitcoin’s history, price has rarely closed below the base CVDD line for any meaningful period.
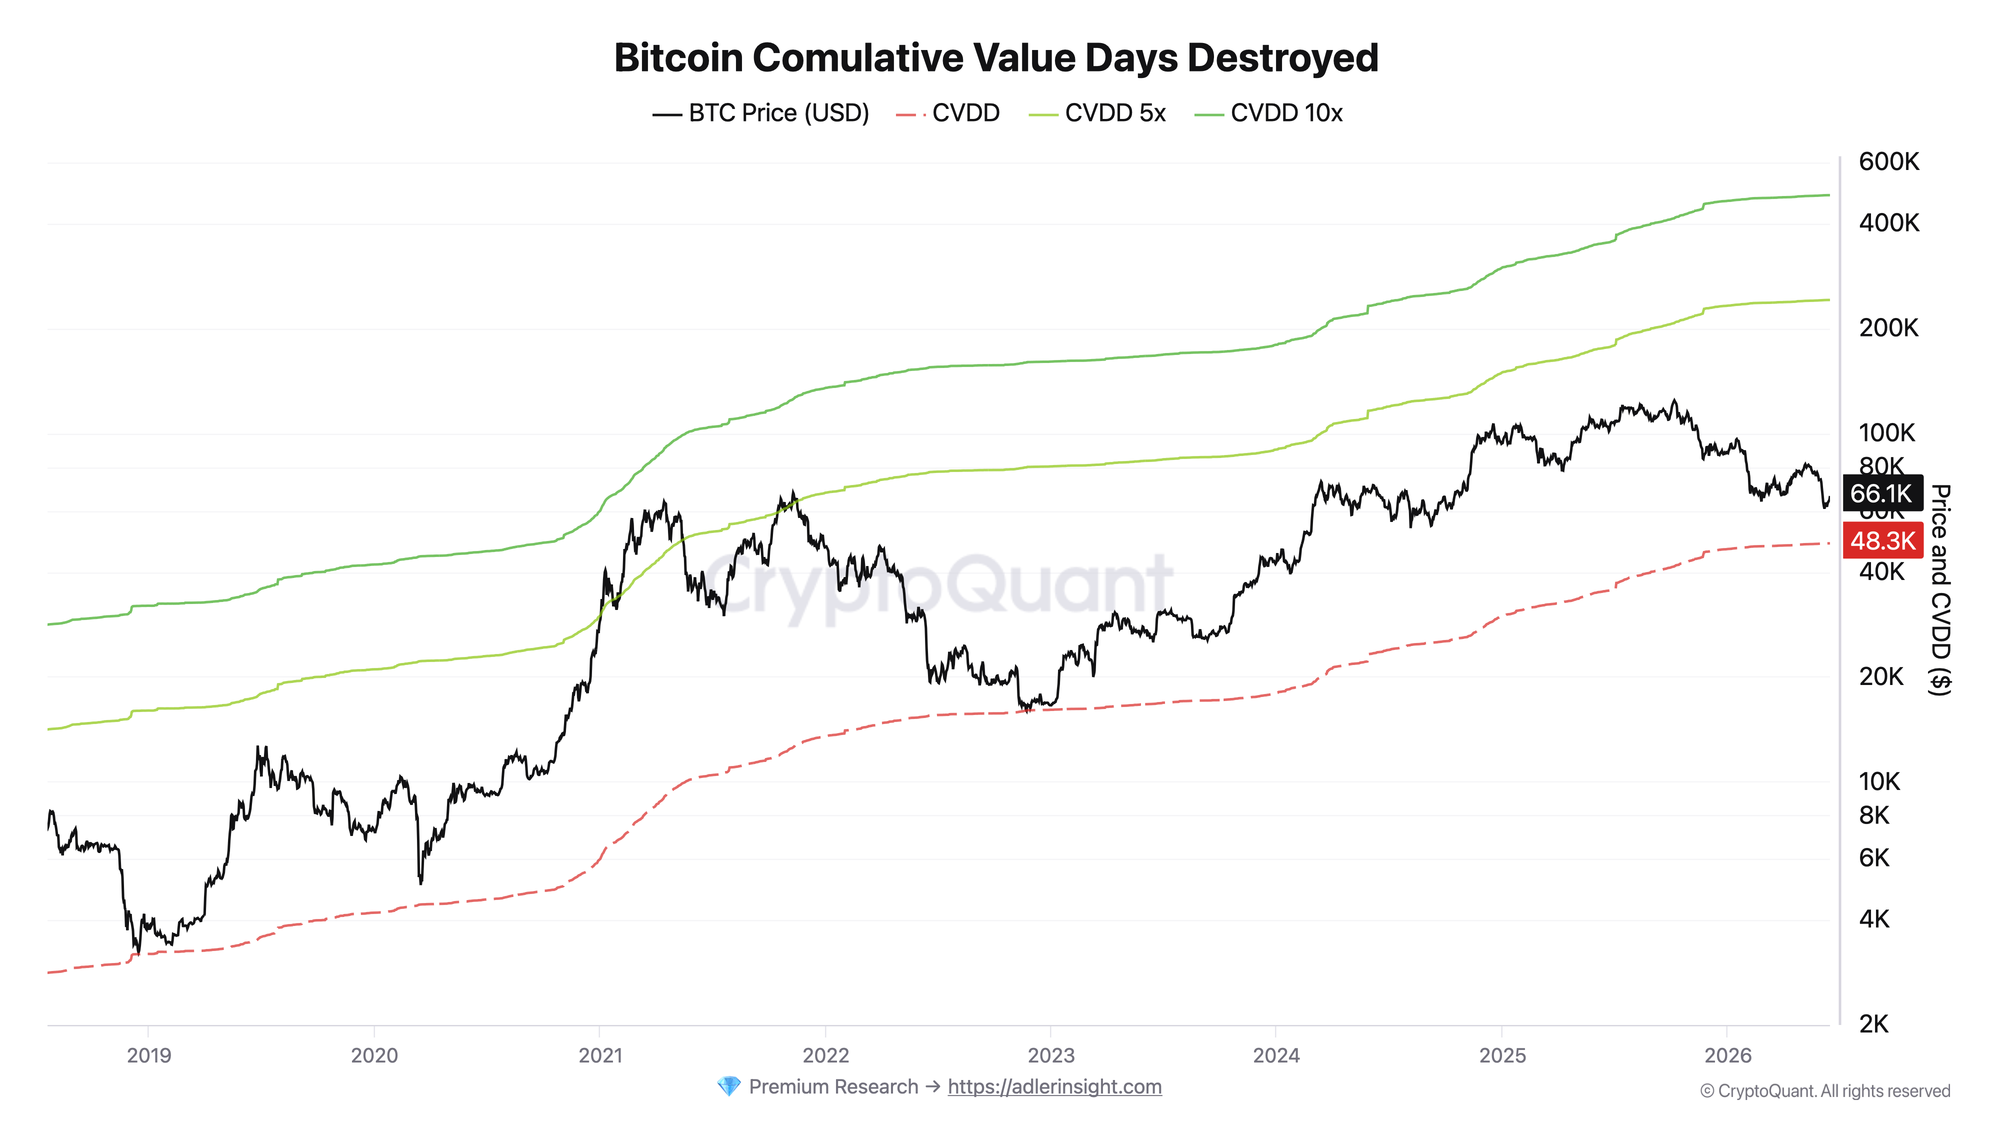
Notably, the CVDD line continues to rise gradually over time, moving Bitcoin’s bottom higher in each cycle. According to the analysis, that line currently sits near $48,300, 25% away from the current price of $65,000.
Interestingly, this aligns with a separate projection from Ali Martinez. His commentary shows that the CVDD line accurately marked the bottom of the 2022 bear market and started a new bull market. $BTC eventually surged to $126,200 three years later from the $15,000 lows.
The last major Bitcoin $BTC market bottom formed when price reached the Cumulative Value Days Destroyed (CVDD) level, marking the start of a new bull market.
Today, that same metric sits around $48,000. https://t.co/uIDjVPWgo5 pic.twitter.com/ddTkpOgV8s
— Ali Charts (@alicharts) June 16, 2026
What Could Confirm the Next $BTC Trend
Adler noted that the next phase will likely depend on whether Bitcoin can maintain its footing above the levels where stress first appeared.
A positive scenario would involve price holding above the $60,000 region while SSRR gradually climbs out of the red zone. Such a development would suggest that the $BTC supply at a loss is shrinking and that selling pressure is beginning to ease.
A bearish scenario involves Bitcoin revisiting lower levels and SSRR producing fresh negative readings. Here, attention could quickly shift toward the CVDD support zone near $48,000. Notably, the asset has not reached that low in the current cycle.