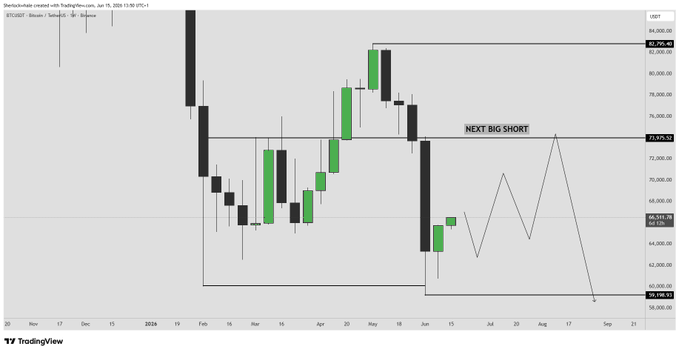
According to the analyst, the structure has appeared 14 times since 2017. In 13 of those cases, Bitcoin traded at least 12% higher within the following eight weeks.
Source: X
That history gives the pattern a reported hit rate of 92.9%. Analysts said the probability of the outcome happening randomly was around 0.18%, or roughly one in 546 cases.
The current setup formed after $BTC dropped from $73,600 to $63,300 two weeks ago. During that same weekly move, Bitcoin touched a low of $59,100 before stabilizing.
Last week, $BTC printed the green inside candle and closed near $65,746. Based on Sherlockwhale’s calculation, a 12% move from that close would place Bitcoin near $73,636.
That projected level sits close to the $74,000 weekly range high. Analysts linked the area to a possible test of the upper boundary of Bitcoin’s price in the recent weekly range. He said a move into the $74,000 area could create a major shorting opportunity if $BTC sweeps the weekly range high before moving lower.
Bitcoin Faces Q3 Drop Risk as ETF Outflows Continue
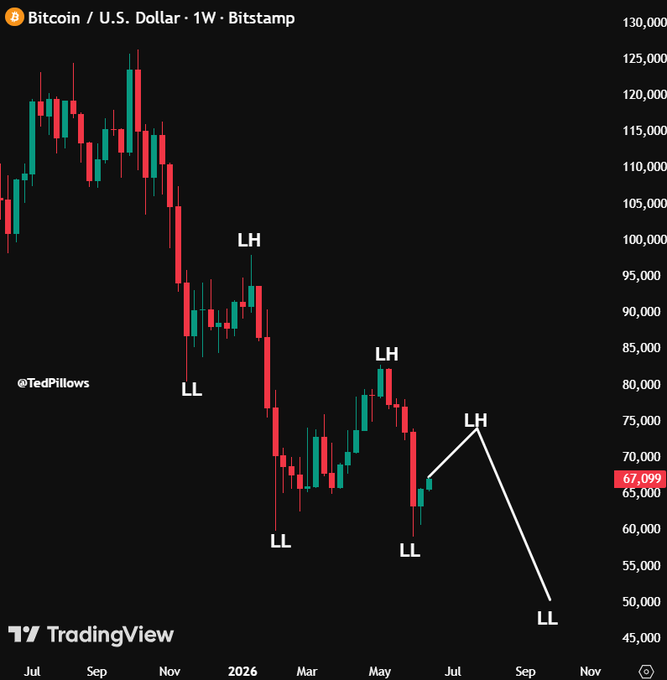
However, analyst Ted also pointed to pressure in Bitcoin’s broader structure. He said $BTC continues to form lower highs and lower lows, which keeps the risk of another decline in view.
Source: X
Ted said Bitcoin could move into the $72,000 to $74,000 zone if the pattern repeats. After that, he said $BTC could fall toward the $50,000 to $52,000 range in the third quarter.
Institutional demand remained weak last week. SoSoValue data showed that spot Bitcoin ETFs recorded $315.84 million in outflows, marking the fifth consecutive week of withdrawals across funds.
The continued outflows showed reduced demand from institutional products. If that trend continues, Bitcoin could face further correction this week despite its recent recovery.
Related: Bitcoin Reclaims $66K, but Japan Rate Hike to 1% Could Trigger Fresh Volatility

 coinedition.com