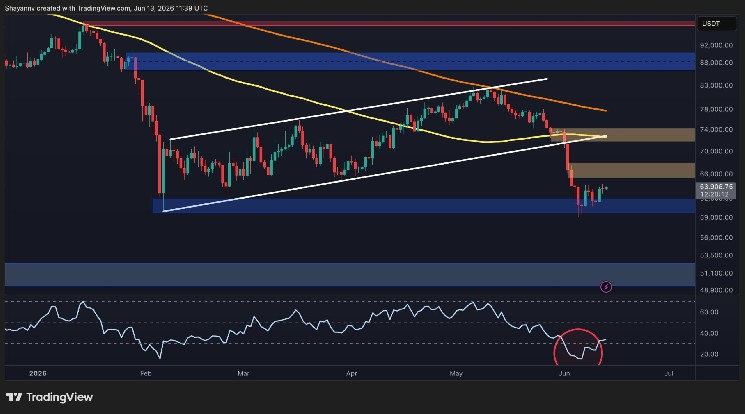
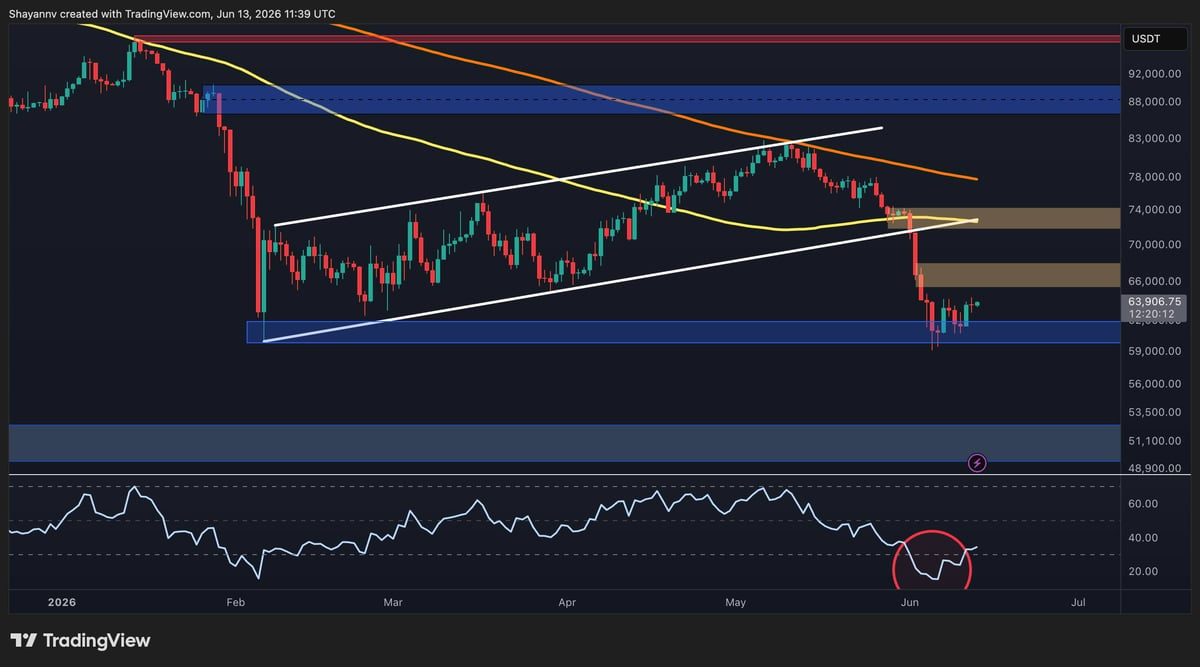
The general structure, however, remains bearish. The asset continues to trade below both the 100-day and 200-day moving averages, which are currently converging above the $70K region. These moving averages will act as dynamic resistance and reinforce the importance of the overhead supply zone.
If $BTC attempts a recovery, the first major resistance lies between $65K and $68K. Above that, sellers are likely concentrated in the $72K-$74K supply zone, which coincides with the breakdown area and former channel support. Reclaiming this zone would be necessary to invalidate the current bearish structure on the daily timeframe.
$BTC/USDT 4-Hour Chart
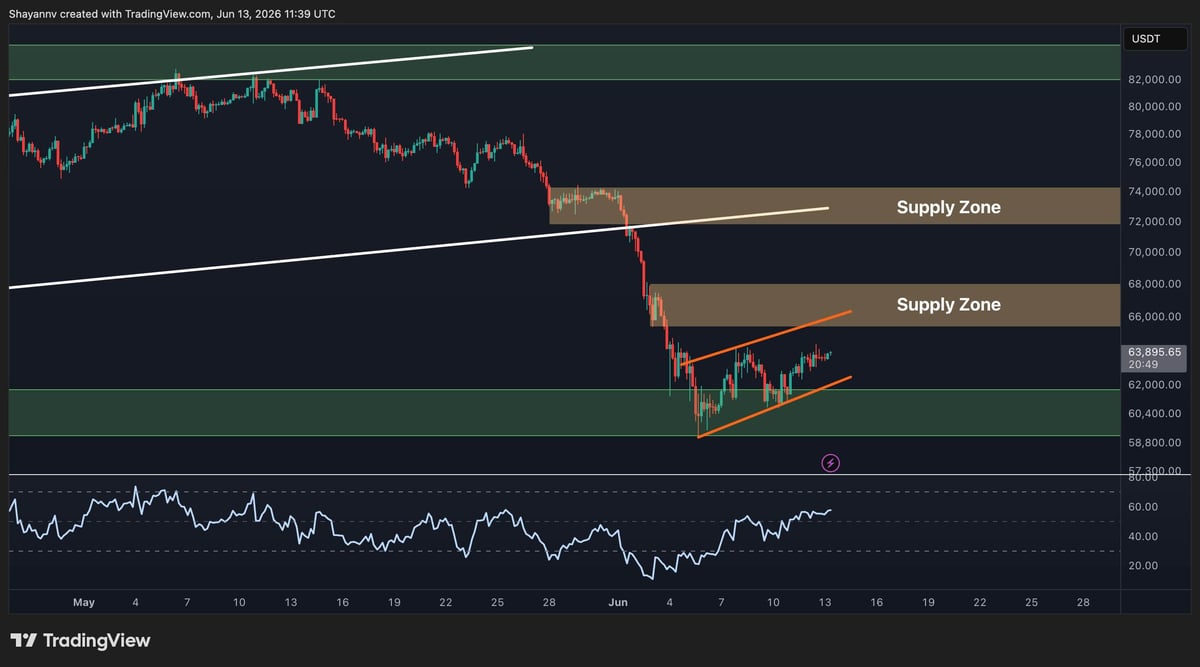
The 4-hour timeframe reveals the first signs of short-term stabilization after an aggressive decline. Following the sharp breakdown from $74K, Bitcoin found support around $60K and has since formed a small ascending channel, which shows improving short-term momentum. The RSI has also recovered from deeply oversold conditions and is gradually pushing higher as bearish momentum is beginning to cool.
Despite this improvement, the current recovery remains relatively modest. The market is approaching the first significant supply zone between $65K and $68K. This area could attract renewed selling pressure and determine whether the rebound develops into a larger recovery or simply another lower high.
A successful breakout above $68K would likely trigger a move toward the more critical $72K-$74K resistance region. Conversely, a breakdown of the current recovery channel could expose the $60K support once again. Losing that level would significantly increase the probability of a deeper decline toward the $51K region. Yet, for now, the short-term structure favors consolidation and relief rallies, but confirmation of a general trend reversal remains absent.
On-Chain Analysis
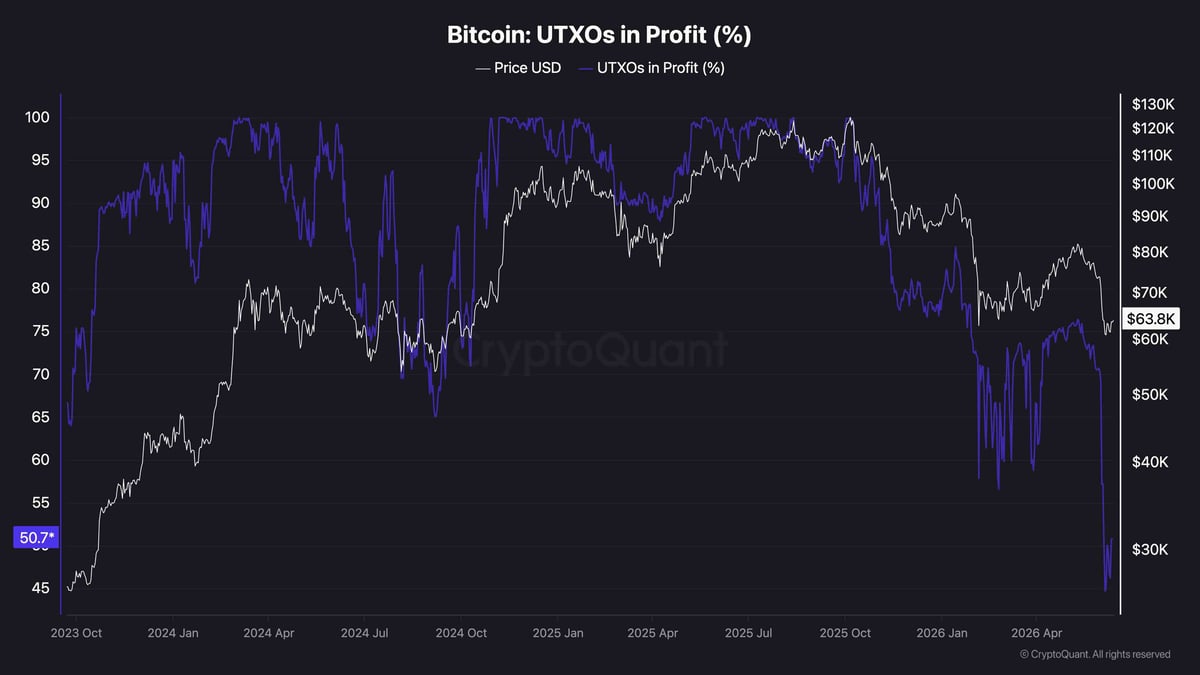
The UTXOs in Profit (%) metric presents one of the most notable developments on the on-chain side. This indicator measures the percentage of Bitcoin’s unspent transaction outputs currently held at a profit. Historically, readings above 90% have been associated with strong bull market conditions, while sharp declines often accompany major corrections and periods of capitulation.
The metric has recently collapsed to roughly 50%, marking one of the steepest deteriorations in network profitability visible on the chart. At current levels, only about half of all UTXOs remain in profit, reflecting the severity of the recent correction and the amount of underwater supply now present in the market.
Historically, such sharp contractions in profitability often emerge during late-stage correction phases when weaker holders have already been forced out of positions. However, they can also precede extended consolidation periods as the market attempts to absorb the newly realized losses.
The combination of $BTC holding above the $60K support zone while UTXO profitability sits near cycle lows creates an important inflection point. If buyers can defend current levels and push the price back above key resistance areas, the extreme decline in profitability could eventually be viewed as a capitulation signal. Until then, the on-chain data continues to reflect a market that has experienced significant stress and has yet to fully recover its previous bullish momentum.

 cryptopotato.com