
A confirmed Bitcoin [$BTC] bottom typically requires alignment between technicals and on-chain data.
From a technical standpoint, the market is trying to hold a potential Bitcoin bottom around $60k, which would help avoid a deeper drop toward the $50k area. Over the past three days, $BTC has been consolidating near $60k, with nearly $1 billion added to Bitcoin Open Interest (OI), showing increased speculative positioning and leverage building in the market.
However, looking at Bitcoin’s technical setup, this move feels more risk-driven than strategic positioning. As the chart below shows, since $BTC’s mid-May rally to $82k, the market has printed three lower lows, suggesting that each support level has failed to attract strong buy-side demand and has instead triggered a series of long squeezes.
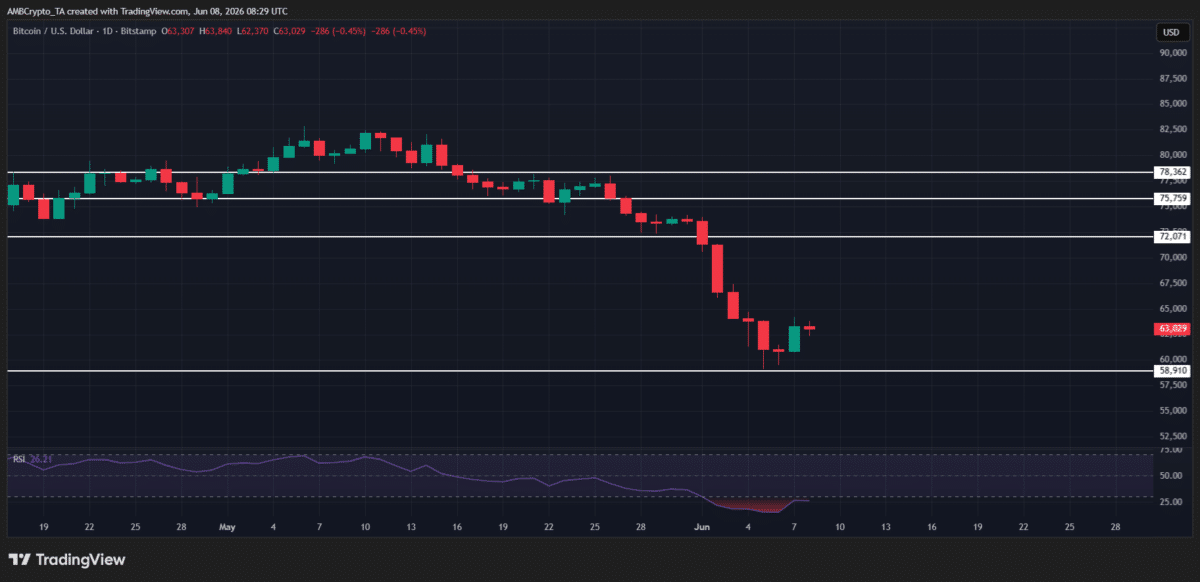
Naturally, the question now is: Are we looking at a fourth lower low forming here?
Notably, alongside rising OI, Bitcoin’s funding rates remain positive, highlighting a market still leaning toward a bullish bias. That suggests traders remain heavily positioned long, which can work fine as long as momentum holds, but it also leaves the market a bit stretched if price starts to roll over or if support fails.
This gets even more interesting when you zoom into Bitcoin’s last 36-hour move. Bitcoin [$BTC] jumped over 4% on the 7th of June, showing early signs of bulls stepping in on the dip. However, if momentum starts to fade from here, the question is whether this turns into a bull trap instead.
Bitcoin signals stay split as the $60k level gets tested
To confirm Bitcoin’s next move, it’s key to see which side takes control: bulls or bears.
At the institutional level, Bitcoin flows still haven’t recovered, with ETF flows remaining negative, highlighting a lack of dip-buying despite $BTC’s sideways chop around the $60k level and reinforcing risk-off sentiment.
From a technical perspective, this kind of weak flow backdrop makes the current range more fragile. Price action alone can hold support for a while, but without sustained inflows to back it up, rallies tend to fade quickly. This gets more interesting when you bring in on-chain signals.
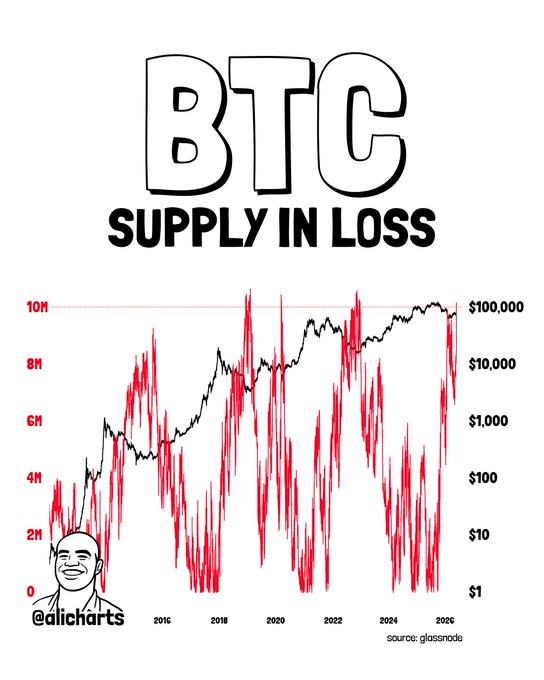
As the chart above shows, Bitcoin has often carved out major bottoms when more than 10 million coins are sitting at a loss. That level has now been reached, with 10.46 million $BTC currently underwater. However, technicals and on-chain signals still aren’t lining up, which keeps the market setup a bit inconsistent.
This lack of confirmation becomes clearer when you factor in other analyst notes. Based on Bitcoin’s $174 billion in realized losses, this is not a record, as the last bear market saw $211 billion in realized losses. That could suggest the market still has room to flush a bit further.
Taken together, this keeps a clean $60k bottom less likely for now. And when you factor in rising speculative interest, Bitcoin’s rally starts to look more like a bull trap, bringing a move back toward $55k into focus.
Final Summary
- Bitcoin is still weak around $60k, with low inflows and high leverage, raising the risk of a drop toward $55k.
- Signals don’t confirm a bottom yet, so the recent bounce could be a bull trap.