
There is something peculiar in the way Bitcoin is moving right now. The Bitcoin price today is fluctuating around $63,228, a few thousand dollars above the recent low that broke through $60,000 for the first time since November 2024. There has been a rebound, technically evident. However, those with experience know that the most dangerous rebounds are born precisely within the strongest bearish trends, and the current one, on the daily, is anything but exhausted.
The macro context does not help: Michael Saylor, who for years has been the symbol of institutional hodl-mentality, has sold $BTC for the first time in four years. This is not a negligible detail. Markets read symbols, and this has been interpreted as a signal of partial capitulation by an actor who seemed unshakable.
The daily says everything there is to know
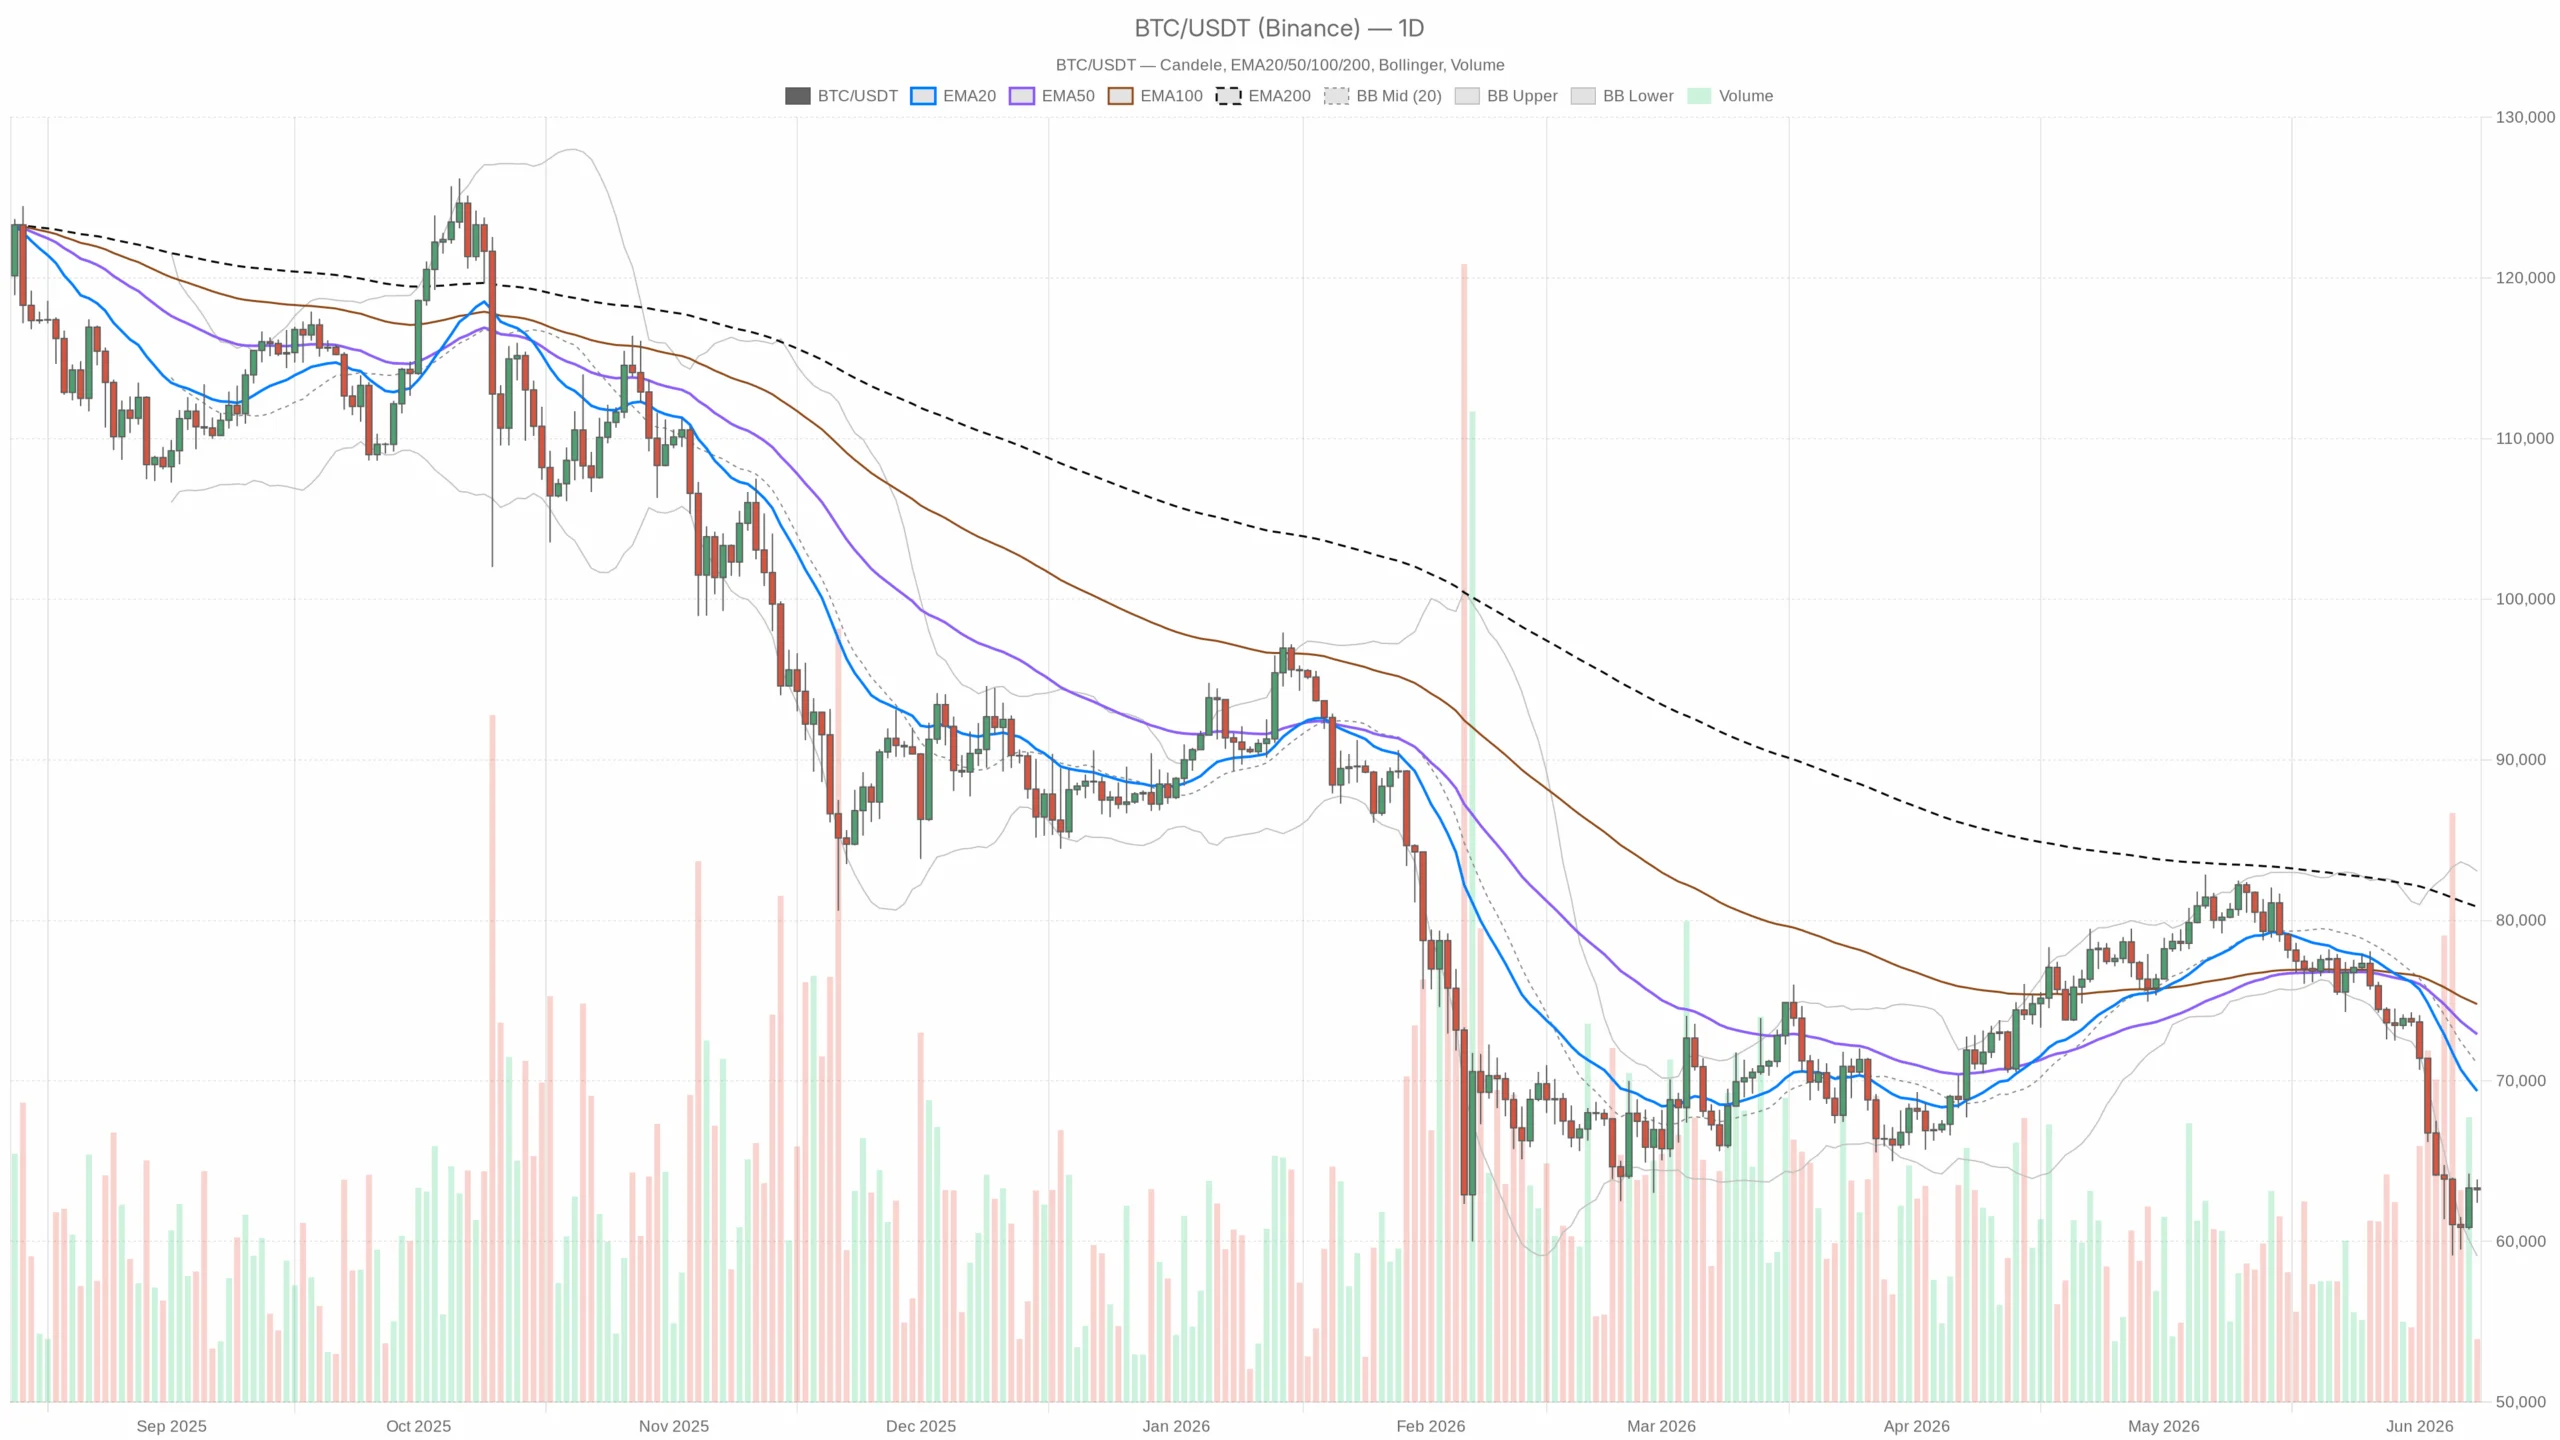
On the daily timeframe, the structure is unequivocally bearish. The current Bitcoin value is well below the 20, 50 and 200-period exponential moving averages — respectively at $69,370, $72,908 and $80,844 — all sloping downward and progressively distant. This type of configuration, with the EMAs cascading down and the price below all three, leaves no room for ambiguous interpretations: we are not in a phase of sideways consolidation, but in a structured downward trend.
The daily RSI at 26.41 is in oversold territory. However, oversold on the daily is not automatically a buy signal. In prolonged bearish trends, the RSI can stay below 30 for weeks, and often the rebounds it generates are traps for those who buy too early. This level indicates that the selling pressure of recent months has been intense and sustained, not that it has ended.
The daily MACD is deeply negative, with the line at -4,020 and the histogram widening the gap to -1,068. No hint of reversal or crossover forming. The bearish momentum, at this time scale, is still in full force.
The daily Bollinger Bands tell an interesting story: the lower band is positioned at $59,096, while the upper one reaches $83,059. The price is moving in the lower half of the channel, having just bounced off the lower edge. A bounce from the lower band could generate a move toward the middle band at $71,078, but only if accompanied by a real change in momentum, which at the moment on the daily is not evident.
The 14-period ATR is at $2,670: daily volatility is significant, an important figure for risk management. With swings of this magnitude, a poorly placed stop can cause losses in a few hours.
The daily pivot levels indicate immediate support at $62,469 and resistance at $63,924. The price is exactly in the middle, above the pivot point at $63,166. This is a position of short-term uncertainty, wedged between two nearby technical levels.
The hourly and 15-minute tell another story
If the daily is the judge, the hourly is the defense attorney. On the H1 timeframe, the situation looks different: the Bitcoin quote today is above the 20 and 50-period EMAs ($62,616 and $62,241), the hourly MACD is just positive with the histogram at +16, and the RSI at 60.36 shows a recovery of short-term momentum. The H1 regime is classified as neutral, but with a bullish tilt.
On the 15 minutes, the picture is even more robust: all three EMAs are aligned in a bullish configuration, the MACD shows an expanding histogram at +29 and the RSI at 58 still has room before entering overbought. The regime is explicitly bullish. Those trading intraday have had momentum on their side in recent hours.
The conflict between timeframes is real and it must be stated clearly: the main trend is bearish, but the short-term rebound is technically structured. It is not random noise. It is a move with a precise logic, but set within an unfavorable macro context.
Sentiment amplifies everything
The Fear & Greed Index at 8 is classified as Extreme Fear, a figure to be interpreted carefully. Historically, extreme fear values coincide with market bottoms, but also with the most violent free-fall phases. The market is not in the grip of sudden panic: it has been in it for weeks. When fear becomes normalized, it loses effectiveness as a reliable contrarian indicator.
Bitcoin’s dominance at 56.16% indicates that the capital remaining in the crypto market has taken refuge in the main asset. This is not a bullish signal in the strict sense — often dominance rises precisely when altcoins are being sold off indiscriminately — but it suggests that there is still a certain relative confidence in $BTC compared to the rest of the market.
Two scenarios, two thresholds
The bullish scenario is plausible. If the ongoing rebound decisively breaks through the resistance at $63,924 (R1 of the daily pivot) and subsequently $65,413 — which corresponds to the 200 EMA on the hourly — a window would open toward the $67,000–$69,000 area, where the daily 20 EMA passes. That would be the first real test of a regime change. This scenario is invalidated if the price falls back below $62,469 with strength.
The bearish scenario is the structurally dominant one. If the current rebound runs out below $63,900 without a real change in momentum on the daily, the probability of a return toward the lower band of the daily Bollinger Bands is concrete, in the $59,000–$59,500 area. A break of $59,000 could open the way to lower levels, with the next relevant support hard to identify before $55,000–$57,000. This scenario is invalidated only with a convincing daily close above $67,000.
How to read this moment
The real-time $BTC price at $63,000 is a technically interesting but narratively dangerous level. The rebound is real, but the trend has not changed. Those trying to buy the bottom in a structured downtrend of this magnitude — with all the daily moving averages pointing downward and the MACD still in deeply negative territory — are betting on a reversal that the charts have not yet authorized.
The most likely false signal in this context is exactly what we are seeing: a solid intraday rebound, with a bullish regime on M15 and neutral on H1, which convinces short-term traders to go long, only to then run out against daily resistances. This is the classic pattern of dead cat bounces in bear markets.
The main risk is not buying or selling in the wrong place, but confusing the timeframe: trading on M15 while thinking you are riding a daily reversal. These two moves have completely different time scales, and mixing them without awareness is the fastest way to end up trapped in a wrong position.
Those who want to trade the rebound can do so, but with reduced size, a tight stop below $62,400, and without expectations that this recovery represents something structural. Today’s updated Bitcoin price deserves a tactical reading, not an investment thesis.