
Bitcoin’s drop below $72,000 has split analysts between two key downside zones: the $50,000-$54,000 MVRV support area and the $61,000-$62,000z channel breakdown target.
The latest charts show Bitcoin near a major technical test, with one model warning of deeper losses while another suggests the main bearish target has already been reached.
Bitcoin Price Risks Deeper Drop as MVRV Bands Show Support Near $50K
Crypto analyst Ali Martinez warned that Bitcoin could face further downside after breaking below the $72,000 level, citing Glassnode's MVRV Pricing Bands model.

Bitcoin MVRV Pricing Bands. Source: Glassnode / Ali Martinez on X
The chart shows Bitcoin trading near $67,180, below the MVRV mean band at $94,163 and slightly under the -0.5 deviation band at $72,444. According to the model, Bitcoin has entered a weaker zone where historical support becomes less dense.
The next major support area on the chart sits between the realized price level at $53,909 and the -1.0 deviation band at $50,726. Martinez argued that this range could become Bitcoin's next downside target if current support fails to hold.
MVRV (Market Value to Realized Value) Pricing Bands measure how far Bitcoin's market price deviates from its realized price, which represents the average cost basis of coins in circulation. Historically, upper bands have often aligned with cycle tops, while lower bands have frequently acted as accumulation and support zones during corrections.
The chart shows Bitcoin previously finding support near the lower MVRV bands during major pullbacks in 2022 and 2023. If that pattern repeats, the $50,000-$54,000 area could become an important region for traders watching the current decline.
However, Bitcoin remains above both the realized price and the -1.0 deviation band. As long as those levels hold, the MVRV model suggests the long-term bull market structure would remain intact despite the ongoing correction.
Bitcoin Price Hits Technical Breakdown Target as Analyst Says Bearish Scenario May Be Exhausted
Crypto analyst SuperBitcoinBro said Bitcoin has already reached the downside target generated by its recent breakdown from an ascending channel, suggesting the technical move may now be complete.
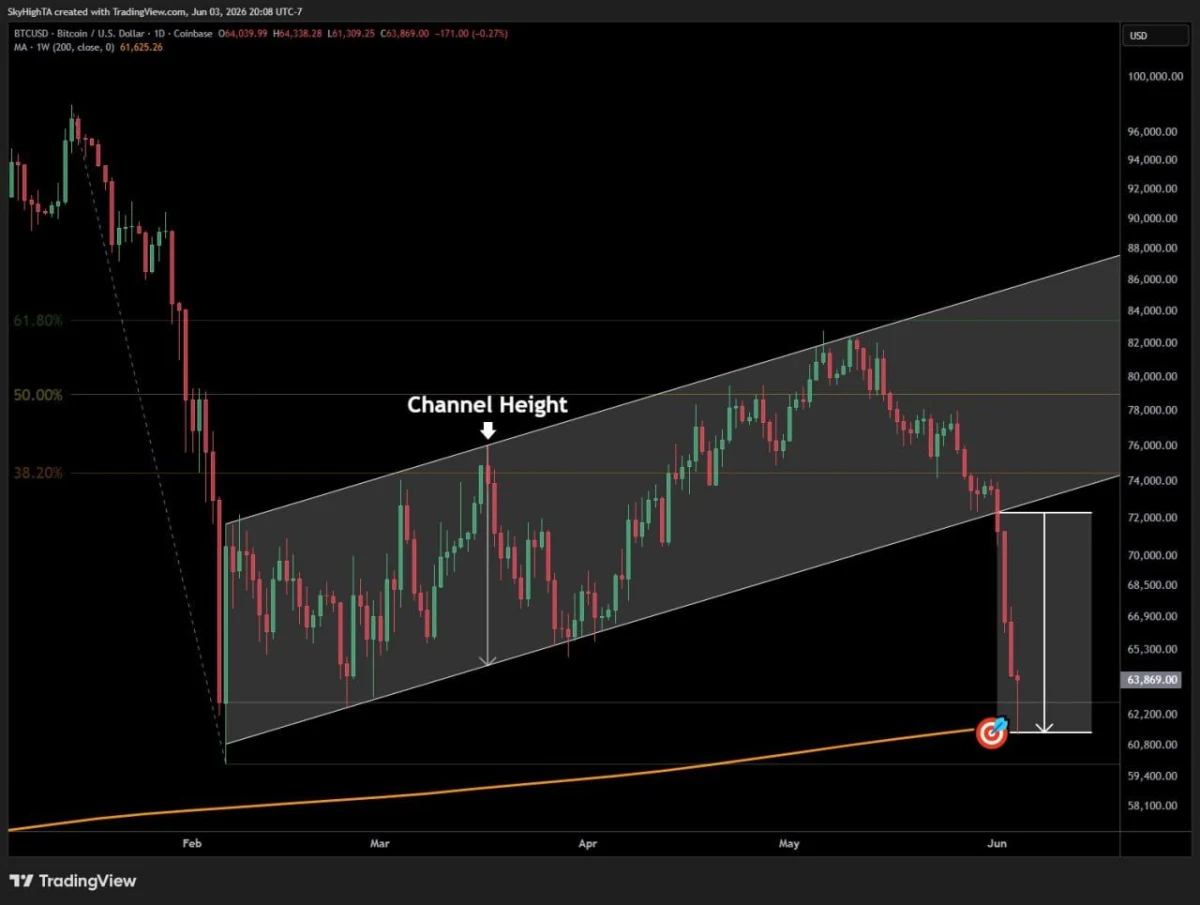
Bitcoin Daily Chart (BTC/USD). Source: SuperBitcoinBro on X / TradingView
The chart shows Bitcoin falling sharply after breaking below the lower boundary of an ascending channel that had guided price action since February. Using the channel's height as a measured-move target, the analyst projected a decline toward the $61,000-$62,000 region.
Bitcoin has since dropped to approximately $63,869 and briefly tested the projected target zone. According to SuperBitcoinBro, the market reacted almost exactly where the channel breakdown model suggested it would.
The chart also highlights several Fibonacci retracement levels, including the 38.2% level near $74,000, the 50% level around $79,000, and the 61.8% level close to $84,000. Bitcoin lost all three levels during the recent decline before reaching the measured downside objective.
SuperBitcoinBro argued that forecasts calling for substantially lower prices are not currently supported by this technical setup because the primary breakdown target has already been fulfilled. The analyst noted that while further downside remains possible, the chart suggests Bitcoin has reached a key area where selling pressure could begin to ease.
The orange trendline and the 200-week moving average near the $61,600 area remain important support levels that traders may continue to watch for signs of stabilization.