
Bitcoin ($BTC) price is sitting on a knife’s edge near $73,300 after a bearish pattern broke down on May 28, opening a path toward a roughly 10% slide.
Yet the breakdown has stalled. On-chain holders and a quiet derivatives market are quietly defending the line. And one technical level is the only thing standing between range-bound calm and a deeper crash.
Price Breaks Down a Bearish Pattern as Volume Dries Up
On the 8-hour chart, Bitcoin broke down from a head and shoulders pattern on May 28. It is a formation where price builds three peaks with a higher middle peak before slicing under a shared support line called the neckline. The break points lower, with $66,798 (the $66,800 zone) being the projected target. The breakdown was accompanied by a rise in sell-side volume.
Want more token insights like this? Sign up for Editor Harsh Notariya’s Daily Crypto Newsletter here.
However, the follow-through has been weak. Both green and red volume pillars have shrunk steadily since the May 28 breakdown, showing thinning interest below the neckline rather than aggressive selling.
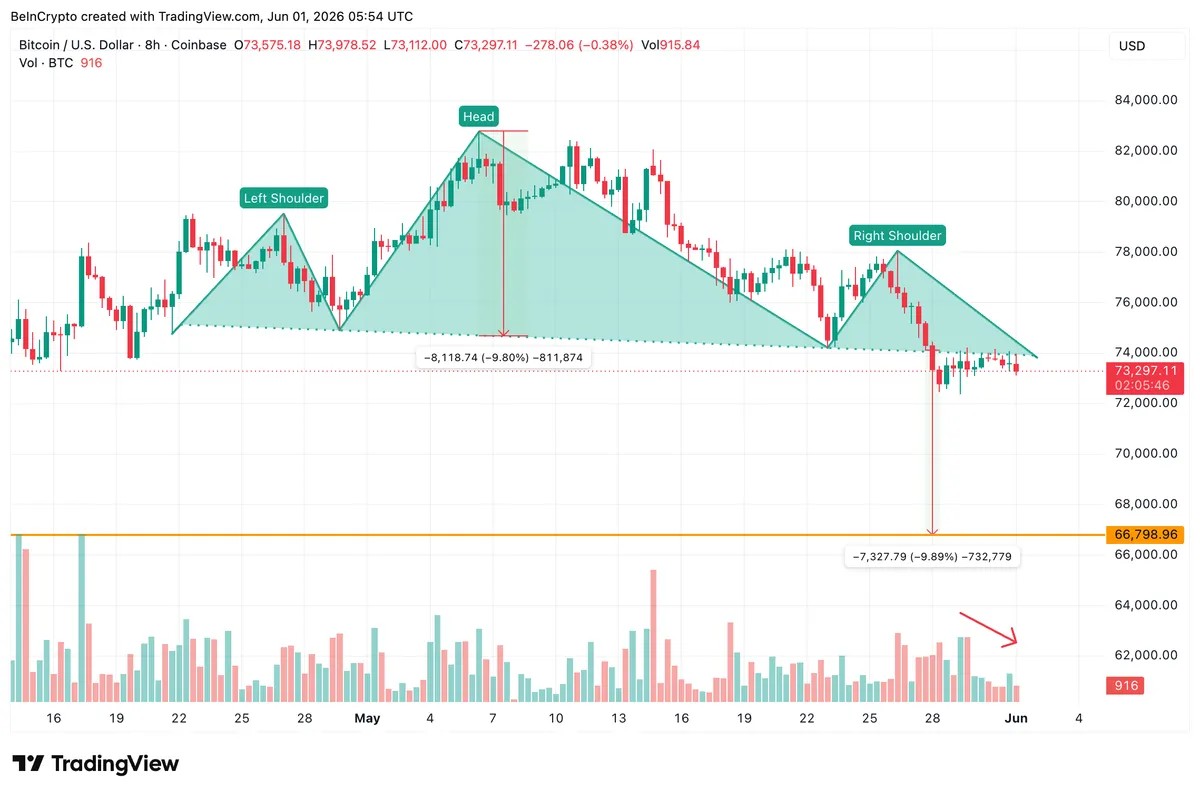
That fading participation has let buyers defend the zone without much resistance. The result is a tight, undecided range instead of the sharp drop the pattern usually delivers. Whether that calm holds depends on what larger holders are doing beneath the surface.
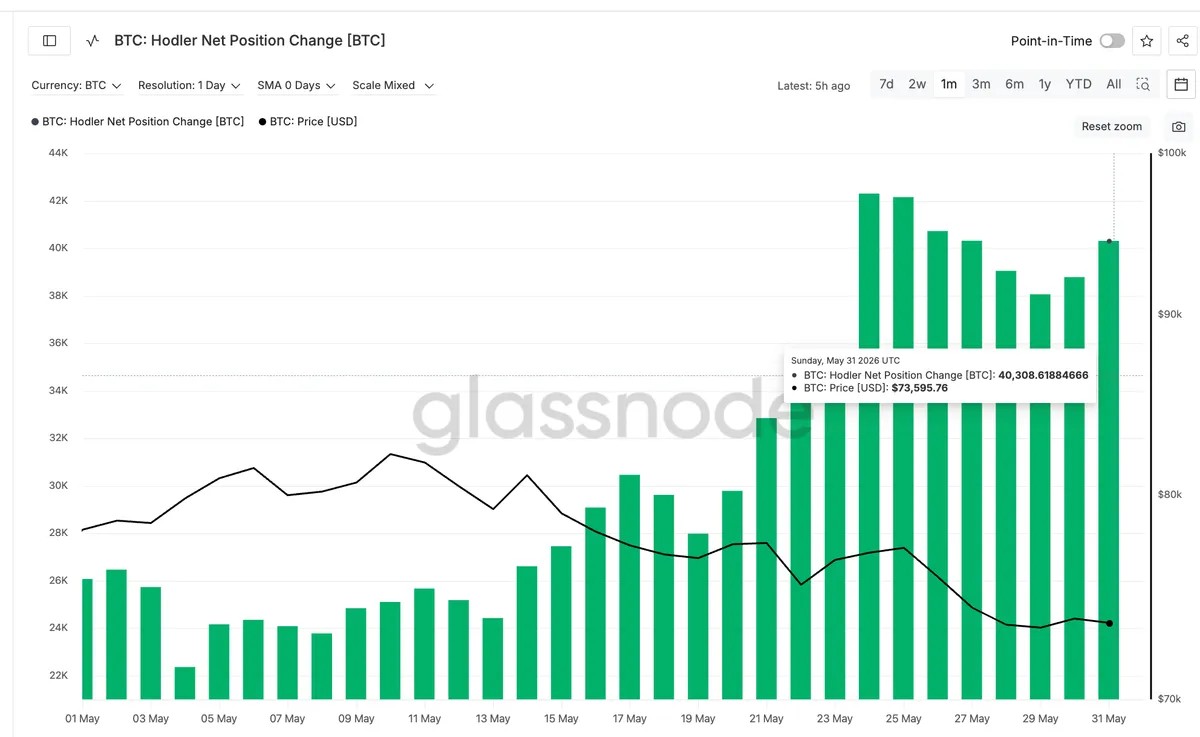
Holders Add Coins as Open Interest Stays Thin
Beneath the $BTC price, conviction appears to be shifting. The Hodler Net Position Change, a metric that tracks whether mid-to-long-term holders are net adding or distributing coins, has climbed since May 29, post pattern breakdown. The reading rose from roughly 38,056 $BTC to about 40,309 $BTC, an increase near 6%, suggesting accumulation rather than panic.
Meanwhile, leverage looks light. Bitcoin open interest, the total value of unsettled futures contracts, has fallen from $34.45 billion on May 14 to about $30.4 billion, one of its lowest levels in weeks.
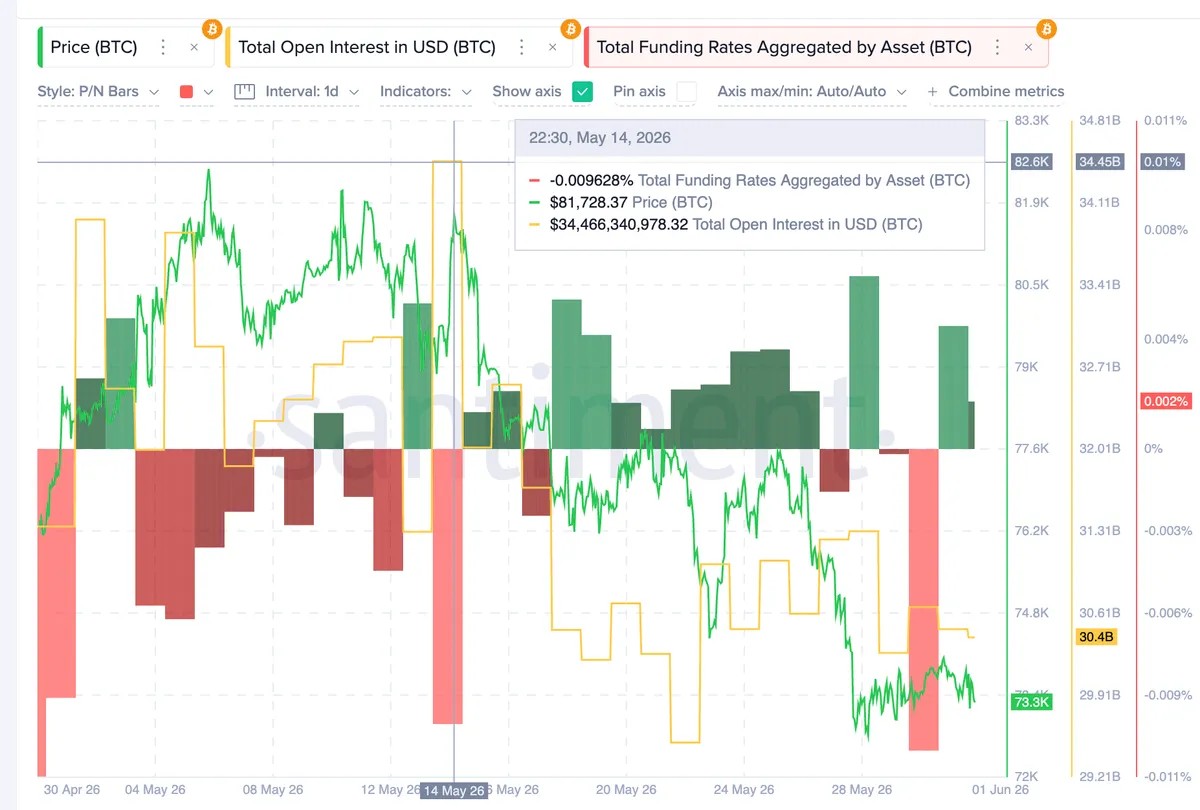
Funding rates, the periodic payments between long and short traders that signal positioning bias, have flipped from negative 0.009% to positive 0.002%. That hints at mild optimism, though it appears too soft to fuel a violent move either way. With leverage drained and holders accumulating, the price chart becomes the decider.
Bitcoin Price Levels to Watch as the Neckline Battle Tightens
The 8-hour chart shows exactly where the fight sits. Bitcoin price broke under the neckline near $73,998 and then the $73,769 support. Yet, it has so far held the 0.618 Fibonacci level, a level that marks a key proportional pullback of a prior move, at $72,754.
That level is the trigger. A clean 8-hour close below $72,754, a drop of barely 1% from here, opens the measured move toward $71,310, then $69,470, and finally the $66,798 pattern target, the full roughly 10% decline from the neckline that broke earlier. The 0.618 has surprisingly held despite the pattern break with sizeable selling volume.
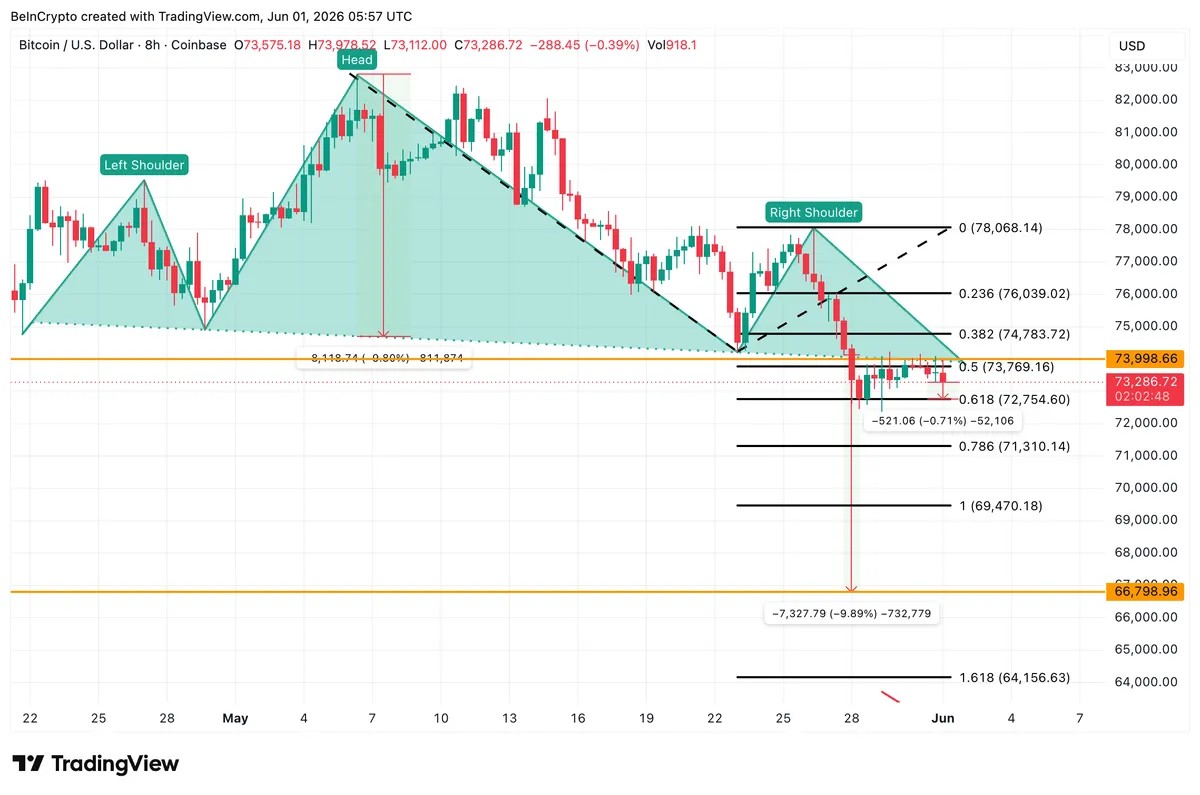
The caveat now is that thinning volume and light open interest mean the pattern could stall without an outside catalyst, such as a fresh macro or policy shock. To flip the bias, Bitcoin must reclaim $74,783, then $76,039 and eventually $78,068.
For now, $72,754 separates a contained range from a 10% breakdown toward $66,798 (the $66,800 zone).
The post Bitcoin Bulls Are Defending One Key Level, Losing It Means a 10% Fall appeared first on BeInCrypto.