
 thecryptobasic.com

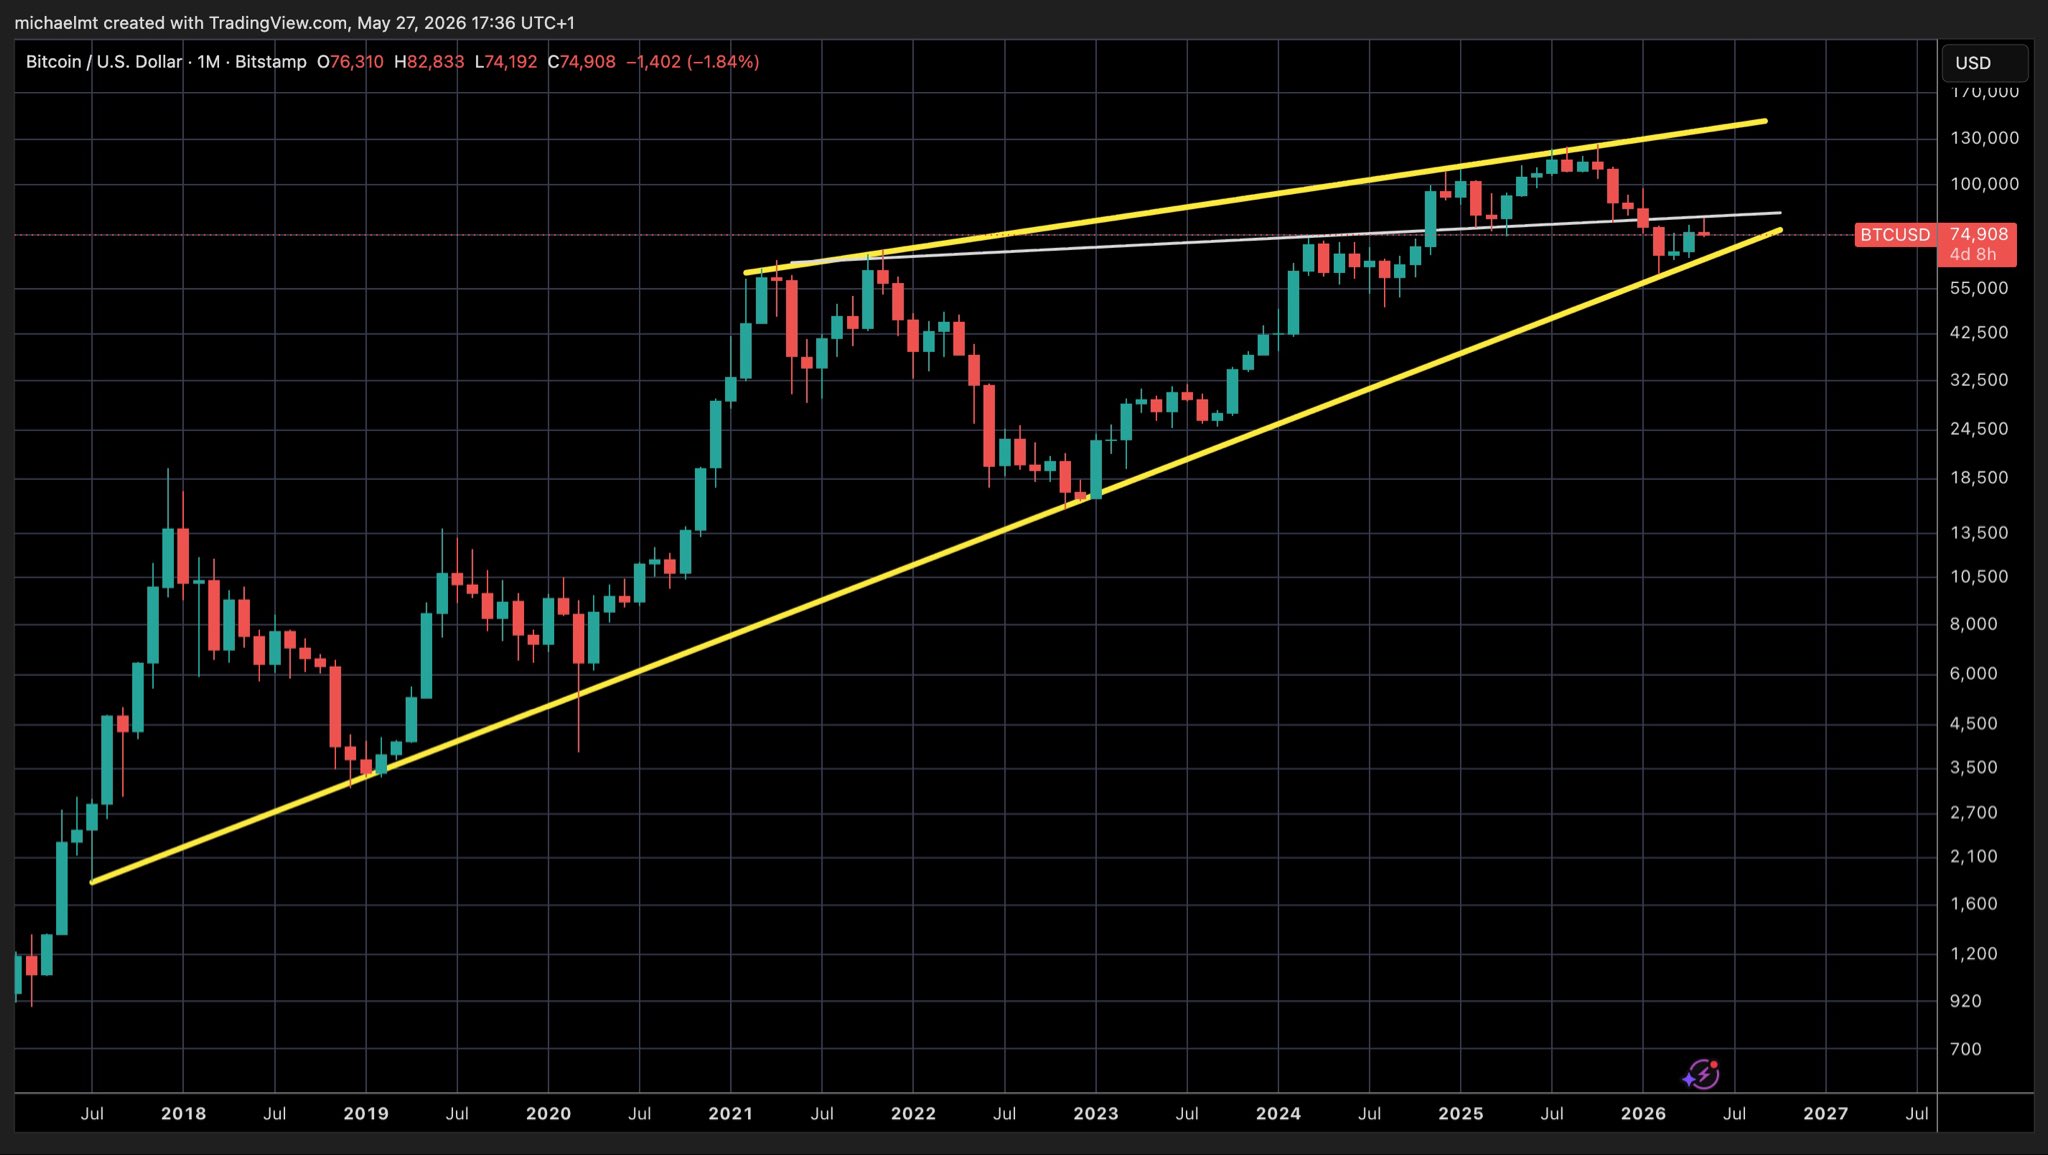
Bitcoin is currently retesting the support trendline of a multi-year wedge and losing it could lead to its largest weekly candle loss in years.
MichaelXBT, a well-known crypto market commentator, was first to call attention to this structure. His commentary comes as Bitcoin ($BTC) collapses below the $74,000 price mark for the first time in over a month amid the latest market-wide pullback.
Key Points
- The latest market-wide pullback has dragged Bitcoin below the $74,000 mark for the first time since April.
- Amid the downturn, Bitcoin is now retesting the support trendline of an ascending wedge on the 1-month chart.
- $BTC could lose this support if it drops below the pivotal psychological $70,000 mark.
- MichaelXBT suggests that if Bitcoin ever drops below the support, it could record its largest weekly candle loss in years.
The Bitcoin Rising Wedge
Data from MichaelXBT’s chart shows that Bitcoin has been trading within a rising wedge since the 2021 bull market.
For the uninitiated, a rising wedge is a pattern in which price moves upward between two converging trendlines, with the lower line rising faster than the upper. The pattern typically indicates that the bullish momentum is weakening and the asset could see bearish price action if it breaks below the lower trendline.
Notably, the lower trendline emerged as a reliable support band in mid-2017 and has continued to cushion against steeper declines for Bitcoin. Meanwhile, the upper trendline started forming during the 2021 bull run, effectively leading to the formation of the rising wedge.
Bitcoin Retests the Wedge Support
Since the rising wedge took shape, Bitcoin had only retested the support trendline once during the 2022 bear market before now. Specifically, the premier crypto asset retested this area when it dropped to $15,400 in November 2022 on the back of the FTX collapse. However, it found strength and recovered.
Now, Bitcoin is again retesting this support area amid the ongoing market downturn. The crypto asset retested the trendline when it collapsed to $60,000 in early February 2026. However, it recovered almost immediately. It again retested the trendline at $64,900 in March and $65,000 in April. Each time, it found strength and bounced back.
With the latest price collapse, bears are now eyeing this support again. A drop to $70,000 would mark the retest of the trendline, and if Bitcoin breaks below this price area, bears could take control of the market. “If that level breaks, bears will be handsomely rewarded,” Michael said in his analysis.
According to his analysis, if the support trendline gives way, Bitcoin could record its largest weekly red candles in years. He insisted that history would be made, but failed to provide any context on the potential extent of this resulting downturn.
Bitcoin Weakness Not a Recipe for New Lows
Meanwhile, crypto market veteran Michaël van de Poppe suggested that while Bitcoin is currently weak, this weakness does not necessarily mean the crypto asset will collapse to new lows. “#Bitcoin showing weakness isn’t a recipe for a new low, as of yet,” van de Poppe said in a recent analysis.
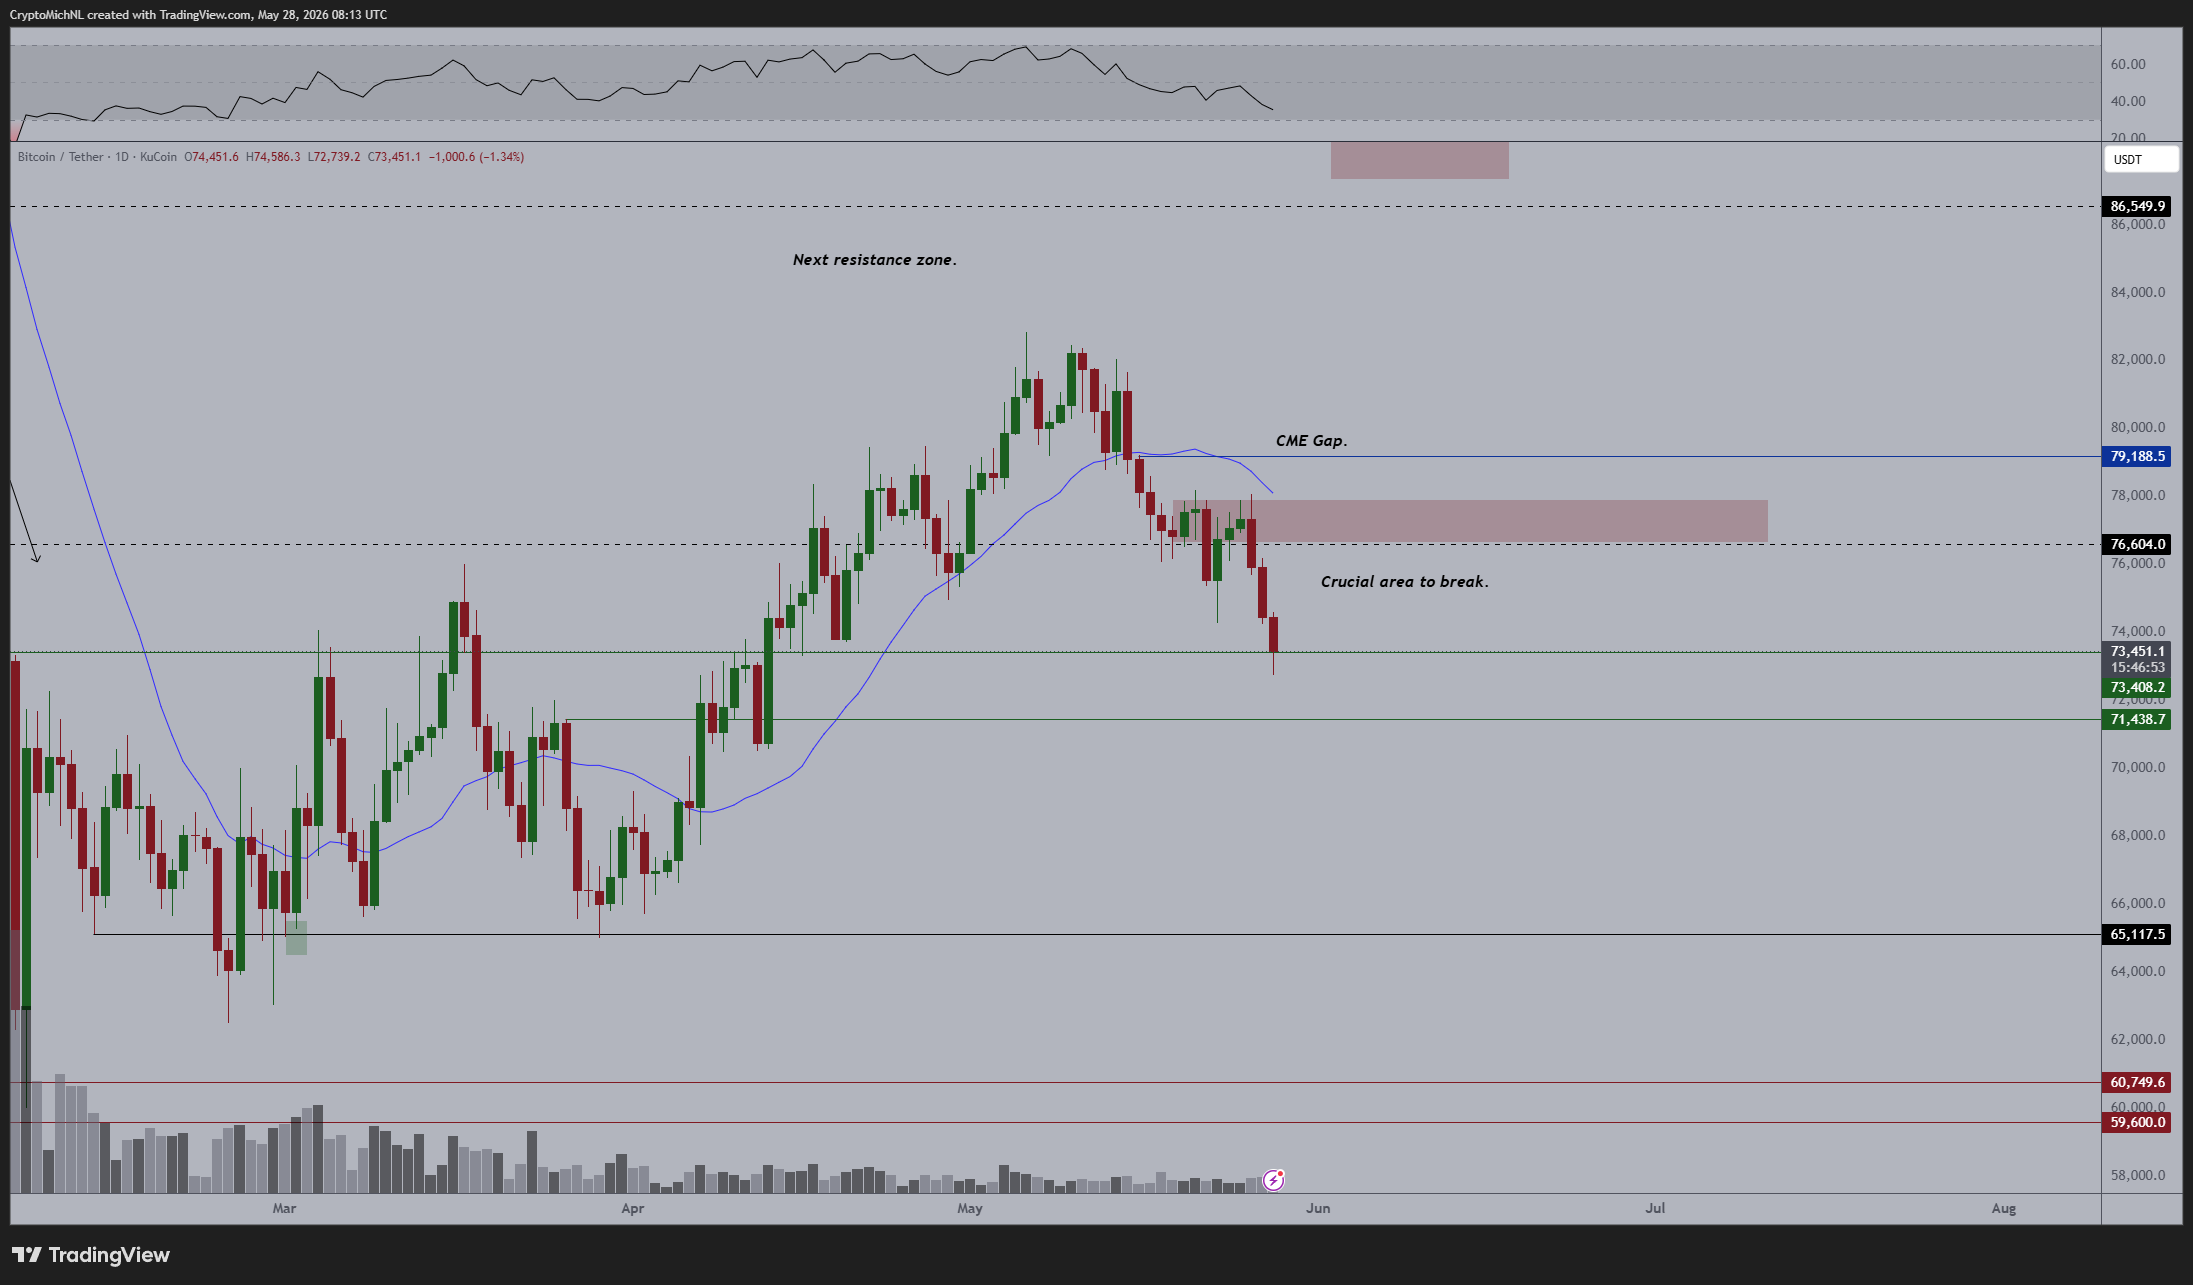
According to him, what the market is currently undergoing is a “standard approach” that occurs toward the end of the month. He noted that during this period, asset managers engage in rebalancing efforts, which could lead to market corrections.
Van de Poppe pointed out that Bitcoin faced rejection at $77,000, and the rejection led to the ongoing downturn. He noted that if the crypto asset fails to hold his crucial support area, it could collapse further toward the lower ends of the $60,000 mark.