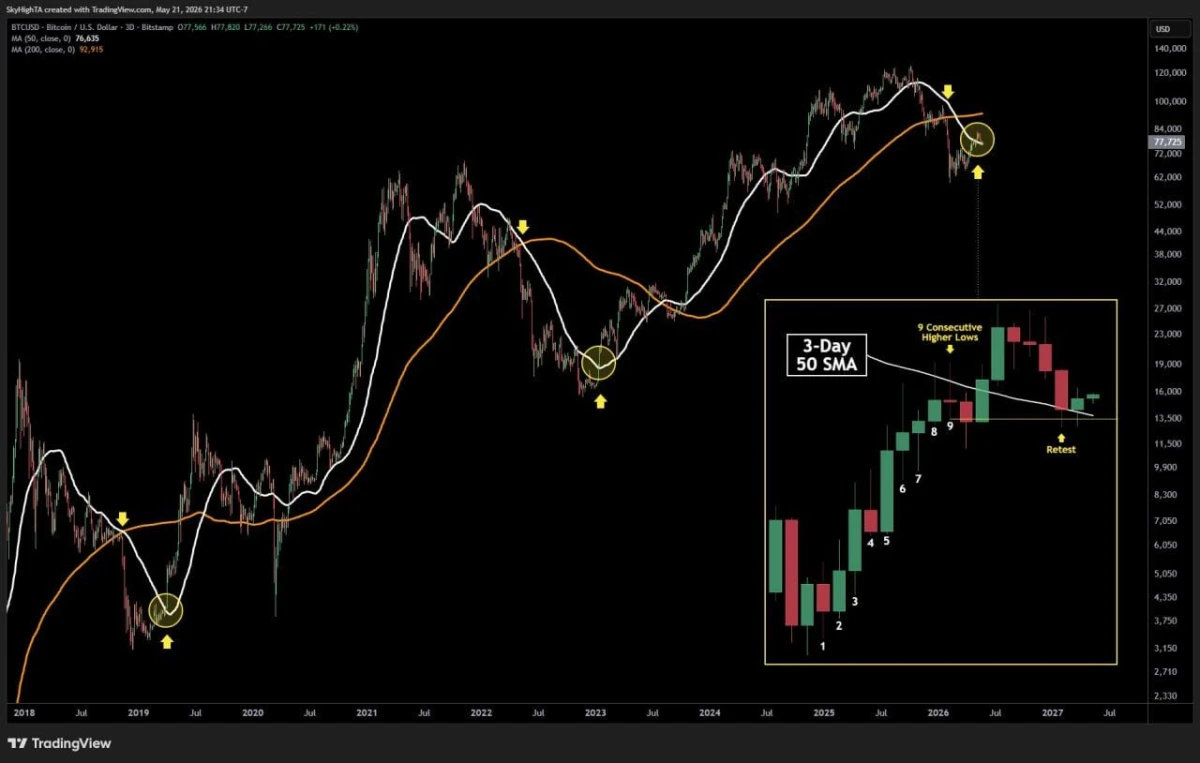
$BTC 3-Day Chart. Source: Super฿ro on X
However, the chart also highlights a second signal. When Bitcoin reclaimed the 50 SMA on the 3-day timeframe, price later entered stronger recovery phases. That happened after the 2019 low and again around the 2023 recovery area.
The current setup shows Bitcoin retesting the 3-day 50 SMA after printing nine consecutive higher lows, according to the inset. That means buyers have defended higher levels during the latest bounce. Still, $BTC needs to hold above the 50 SMA for this signal to matter.
The next major level remains the 200 SMA near $92,915. Until Bitcoin moves back above that area, the broader structure stays under pressure. A clean hold above the 50 SMA would support a short-term recovery attempt, while rejection would keep the chart exposed to another move toward the recent lower range.
Bitcoin Bulls Face $78,600 Breakout Test as Recovery Stays Corrective
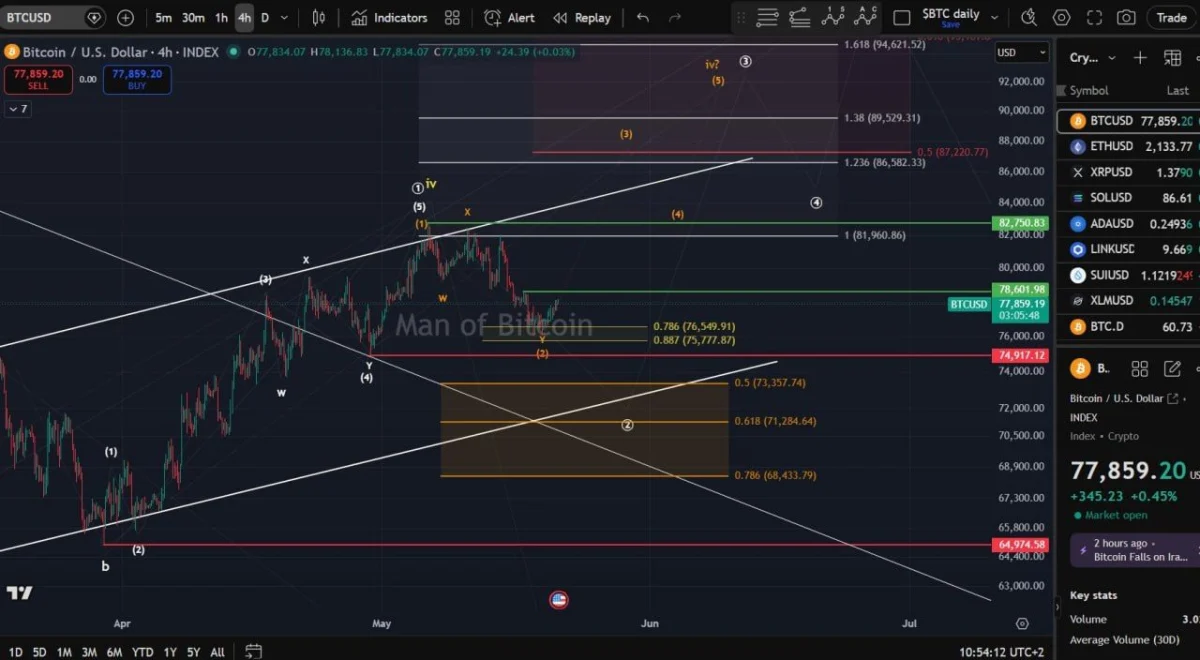
Bitcoin is trying to keep the orange roadmap active, with the next key test sitting near $78,600. A break above that level would open the way toward the larger resistance area near $82,750.
The chart shows $BTC bouncing from the $75,777 to $76,549 Fibonacci zone. That area acted as short-term support after the recent pullback. As long as price holds above it, bulls can still defend the recovery structure.
$BTC 4H Elliott Wave Chart. Source: Man of Bitcoin on X
However, the move does not look fully impulsive yet. The bounce appears corrective because price is rising in a controlled pattern, not with strong expansion. That makes the setup less reliable until $BTC clears resistance with strength.
If Bitcoin breaks above $78,600, the next focus moves to $81,960 to $82,750. A stronger continuation could then target the higher Fibonacci zone between $86,582 and $89,529.
If $BTC fails at $78,600, the lower levels become important again. The first support remains near $74,917. A deeper loss could bring the orange downside zone into focus, especially around $71,284 and $68,433.

 coinpaper.com