cryptopotato.com
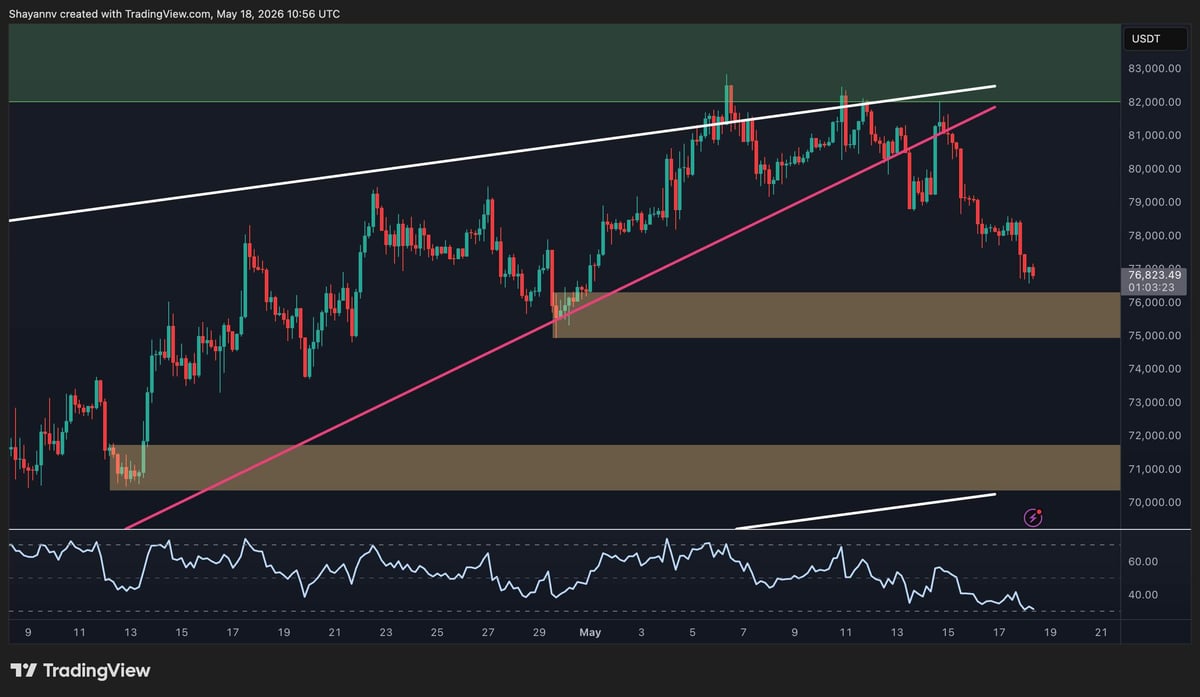
Bitcoin is trading at $76.8k as the third week of May opens. It has surrendered the $80k breakout that defined the prior week’s narrative. The short-term bullish trendline that supported the inner rally structure has been broken, and the price has pulled back into the mid-range of the large ascending channel on the daily timeframe. The support zone at $75k is now the line in the sand.
Bitcoin Price Analysis: The Daily Chart
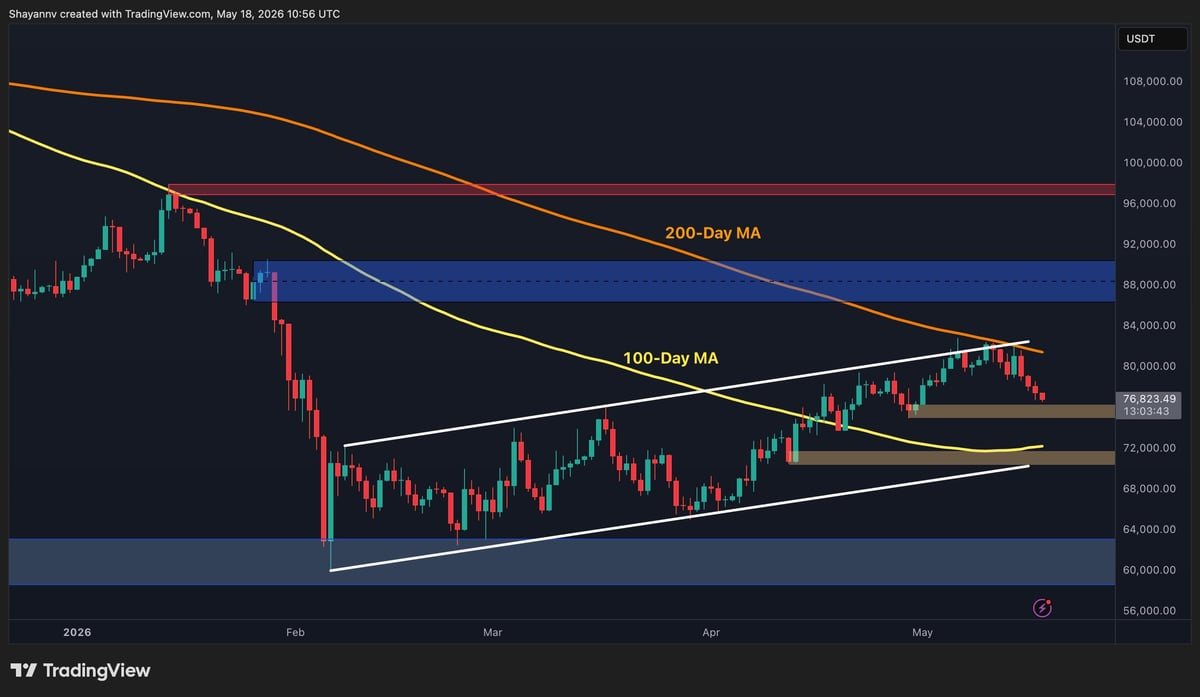
On the daily timeframe, it is evident that the ascending channel breakout has been invalidated, and the asset has returned inside the structure and is now testing the middle portion of the range near $76k–$75k. The 100-day MA has declined to approximately $72k and is approaching from below, providing a rising floor that narrows the downside risk. Yet, the 200-day MA, currently located around $81k, is pushing the price lower from above, after rejecting it decisively.
The support zone at $75k is the critical area to defend, as it represents the most recent bullish order block and short-term swing low. A rebound here and a recovery back above $80k would suggest the pullback was corrective and the broader uptrend intact.