Bitcoin trades at $77,033 on May 18, sliding back below levels it spent two weeks reclaiming, as the 30-year Treasury yield closes at its highest since before the 2008 financial crisis and traders fully price out any chance of a Fed rate cut this year.
Why Bitcoin Is Falling While Stocks Look Calm
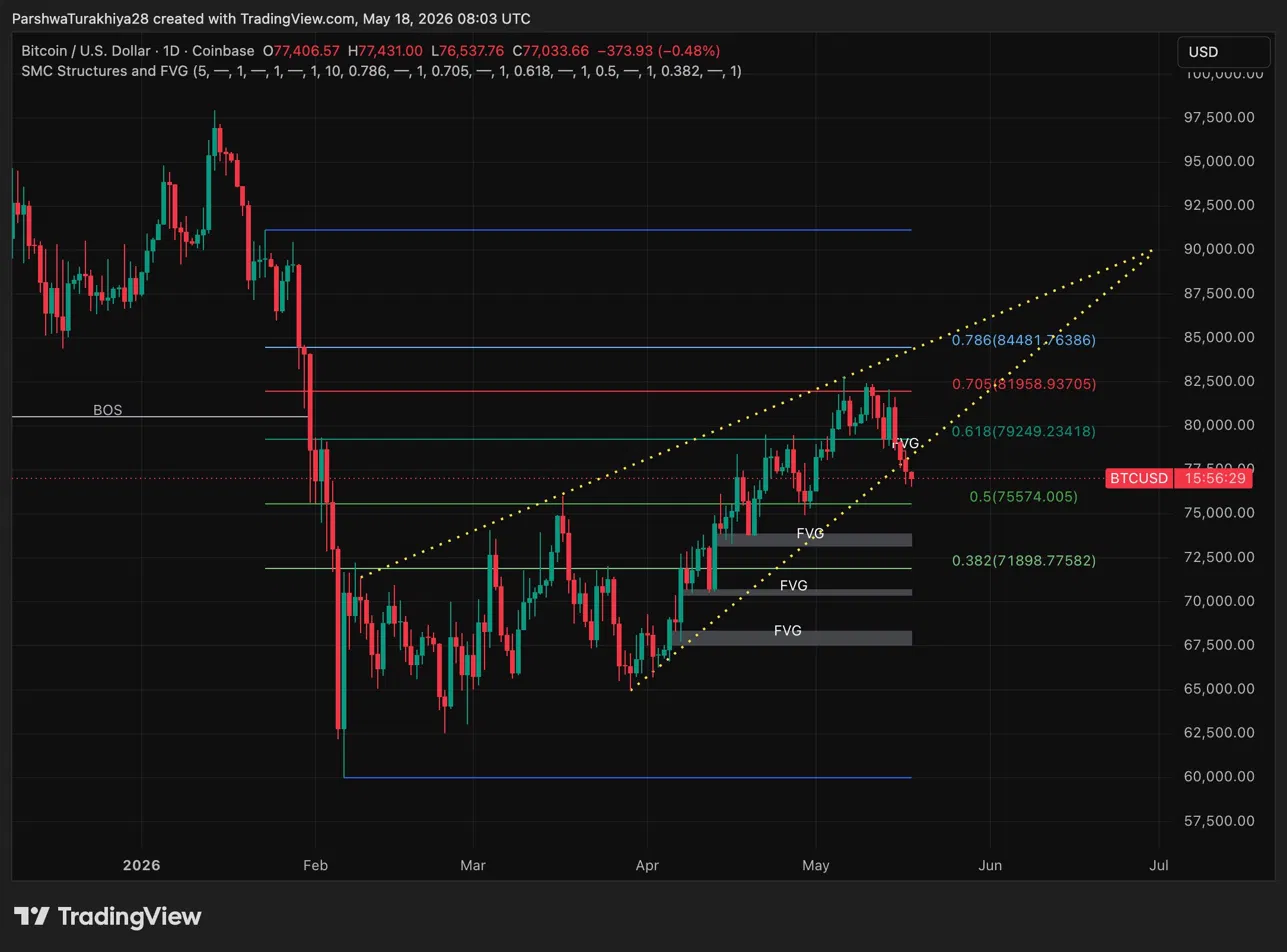
$BTC lost the 0.618 Fib at $79,249 and the 0.705 Fib at $81,958 in quick succession after the bond market repriced sharply higher. The dotted trendline channel that guided price higher from the April lows is also broken.
Three FVG zones stack between $74,000 and $70,000 below current price, with the 0.5 Fib at $75,574 sitting inside that cluster. Those levels were left open on the way up and are the natural targets on further weakness. Reclaiming $79,249 on a daily close is the first step before any recovery has credibility.
$BTC Key levels for May 19:
- Resistance: $79,249 (0.618 Fib), $81,958 (0.705 Fib), $84,481 (0.786 Fib)
- Support: $75,574 (0.5 Fib), $74,000 to $70,000 FVG cluster, $71,898 (0.382 Fib)
30-Year Yield at 5.12%: What That Actually Means for Bitcoin
The 10-year Treasury yield hit 4.63% Monday, the highest since January 2025. The 30-year closed at 5.12%, a level markets had not seen since before the 2008 financial crisis. When guaranteed government bonds offer returns above 5%, institutional capital has a straightforward alternative to Bitcoin and it is taking it.
Related: Zcash Price Prediction: Can ZEC Reclaim $600 as Open Interest Rebounds?
The bond sell-off was driven by CPI printing at 3.8%, PPI accelerating, and crude oil pushing back above $100 a barrel as the Hormuz situation remains unresolved. Energy is feeding inflation directly while simultaneously slowing growth, the worst combination for a Fed already under pressure.
Moreover, Trump warned Iran to get moving or face consequences after leaving China without progress on either trade or the strait. Traders have now fully removed rate cuts from 2026 pricing and are building positions around a potential rate hike. FOMC minutes and flash PMI data are the next events that will either accelerate or slow that shift.
Bitcoin Derivatives: Who Is Actually Getting Hurt Here
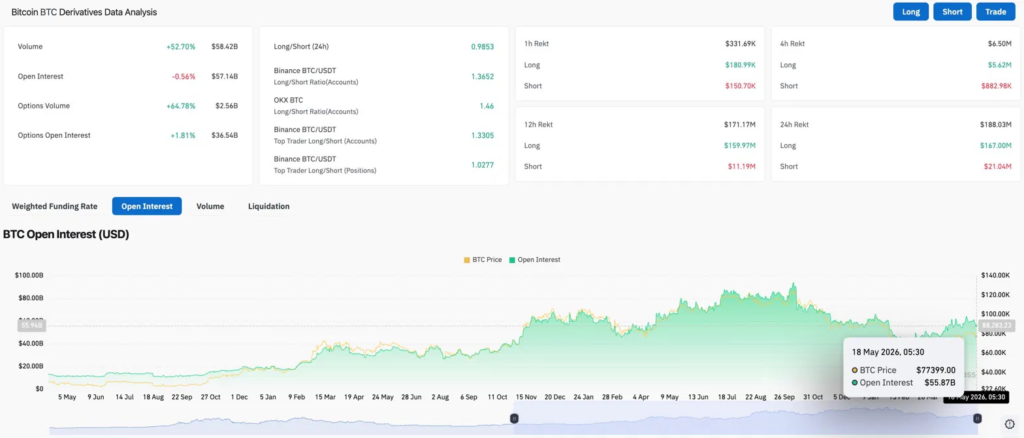
Volume jumped 52.70% to $58.42B while open interest slipped 0.56% to $57.14B. Options volume surged 64.78% to $2.56B, reflecting heavy hedging activity as the macro picture deteriorated through the week. Retail on Binance holds a 1.3652 long ratio while top traders sit near neutral at 1.0277 by positions. That gap tells you professionals have already reduced exposure while retail is still holding.
Over 24 hours, $167M in longs were liquidated against $21.04M in shorts. Longs absorbed eight times more pain. Retail is holding leveraged longs through a macro-driven decline while institutional traders step aside. Bounces are producing short squeezes, as seen in the $882.98K 4H short liquidation figure, but none are sustaining.
Bitcoin Price Prediction for May 19: Key Levels and Catalysts
- Upside: Reclaiming $79,249 on a daily close opens $81,958. Iran-US negotiations producing concrete progress on the strait removes the energy inflation premium. FOMC minutes coming in less hawkish than feared shifts yield expectations and gives $BTC room to recover.
- Downside: Staying below $79,249 with yields holding above 4.60% puts the $75,574 FVG cluster in play. Oil above $100 with no Hormuz resolution keeps inflation bets elevated. A break below $75,574 opens $71,898 to $70,000 where the deeper FVGs sit.
Related: Cardano Price Prediction: New Partner Chain With Airdrop and a Quantum Vote on Friday