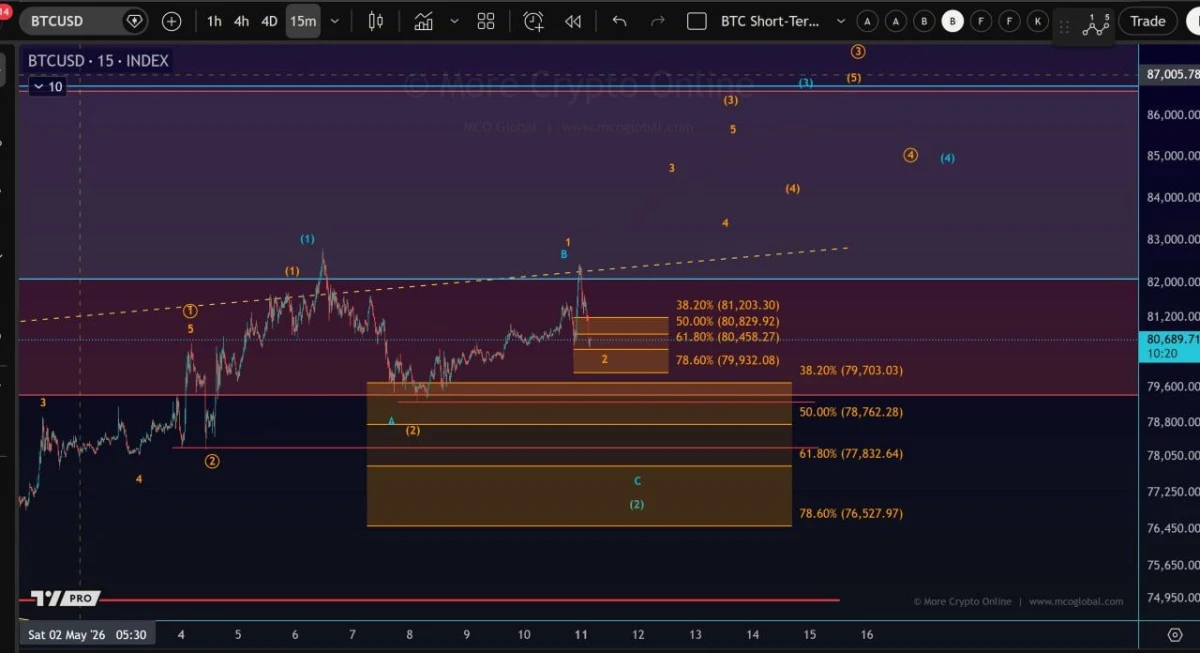
Bitcoin Rejected at Channel Resistance. Source: MCO Global on X
However, a break below this micro support would weaken the short-term structure. MCO Global noted that a move under this zone could open the door for a wider wave two pullback.
The next major support level sits near $76,527, based on the 78.6% retracement shown on the chart. Other support levels appear around $79,703, $78,762, and $77,832, which could act as reaction zones if selling pressure continues.
For now, $BTC remains stuck between channel resistance near $82,000 and support around $80,000. A clean move above the upper boundary would strengthen the bullish setup, while a drop below $79,932 would shift focus toward deeper support.
Bitcoin Weekly Breakout Setup Points to $138K Target
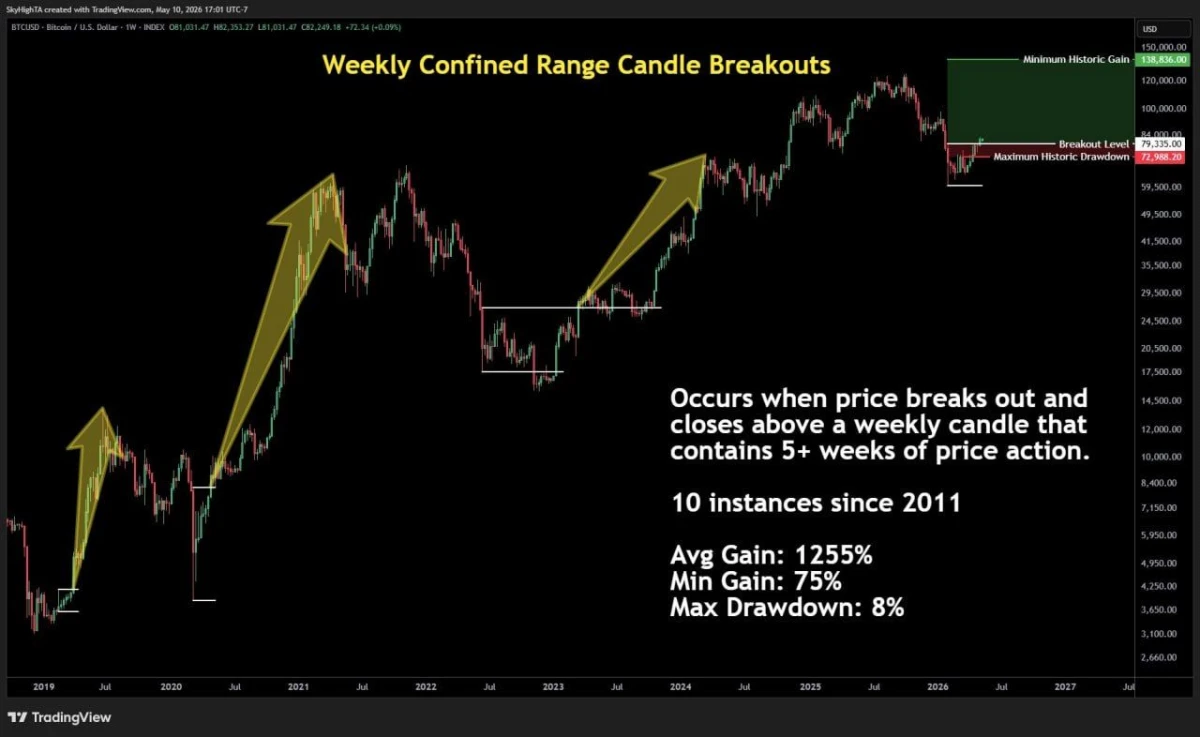
Bitcoin is forming a weekly confined range candle breakout setup, according to the chart shared by Super฿ro. The setup appears when price stays inside the range of one weekly candle for five or more weeks, then breaks and closes above that range.
Bitcoin Weekly Confined Range Breakout. Source: Super฿ro on X
The chart marks the breakout level near $79,335. It also shows the maximum historic drawdown level near $72,988, which represents the downside risk zone after similar past breakouts.
Super฿ro said this pattern has appeared 10 times since 2011. The chart lists an average gain of 1,255%, a minimum gain of 75%, and a maximum drawdown of 8% after past breakouts.
Based on the minimum historic gain, the chart projects a target near $138,836. This does not confirm the same move will happen again, but it shows why traders are watching the weekly breakout structure.
For now, the main level is the breakout line near $79,335. A weekly close above that area would keep the bullish setup active, while a move back toward $72,988 would weaken the pattern.

 coinpaper.com