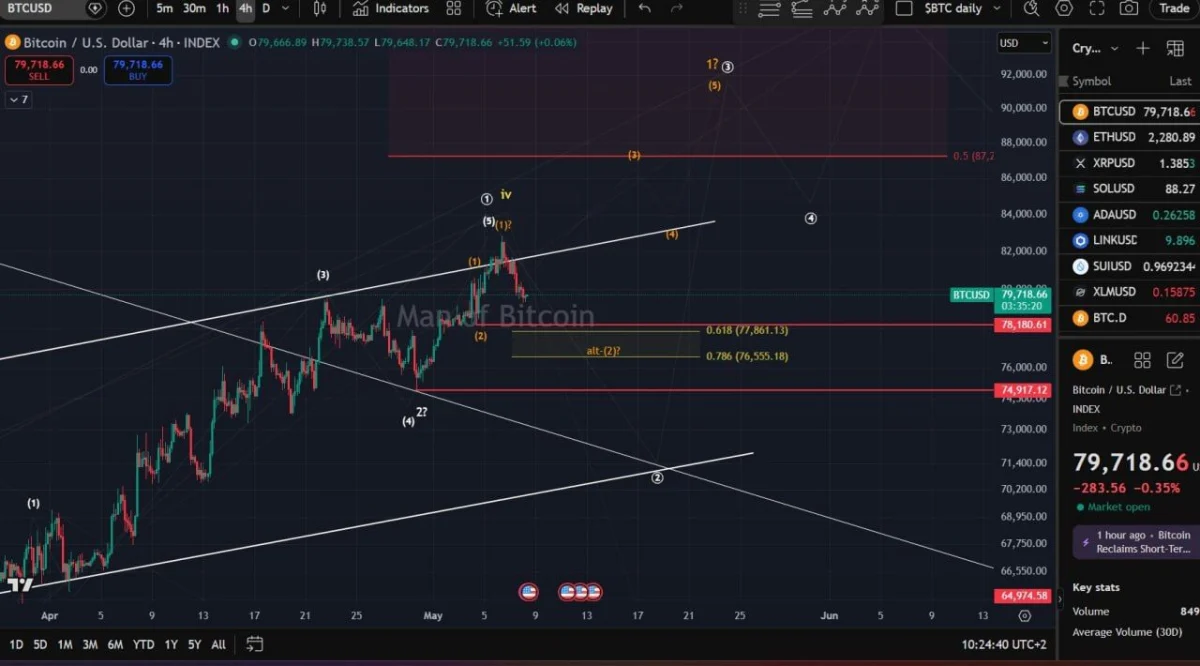
$BTC Bullish Continuation Setup. Source: Man of Bitcoin on X
As long as Bitcoin stays above $78,180, the bullish wave structure remains favored. The chart also marks a possible upside path toward the $87,000 area if buyers regain momentum and push $BTC higher.
However, a break below $78,180 would weaken the current setup. In that case, the chart points to an alternative wave two structure, with key support marked near $74,917.
The Fibonacci area between $77,861 and $76,555 also sits below the current range. That zone could become important if $BTC loses the first support level but avoids a deeper move.
For now, Bitcoin remains above the main invalidation level. The next move depends on whether buyers can defend $78,180 and turn the latest pullback into another continuation move.
Bitcoin Enters Weekly FVG as $BTC Eyes $84K CME Gap
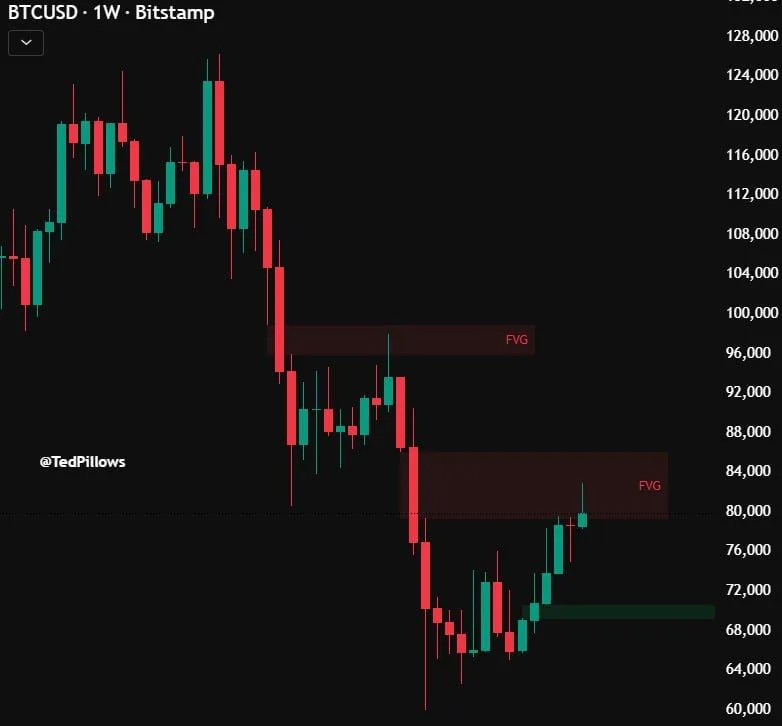
Bitcoin entered its weekly fair value gap after its latest recovery move, according to a chart shared by Ted on X.
The chart shows $BTC moving back into the marked FVG zone near the $80,000 area. This level matters because the previous local top also formed inside a weekly FVG, according to the analyst.
$BTC Weekly FVG and CME Gap: Source: Ted on X
Ted also pointed to a CME gap around the $84,000 to $85,000 range. If Bitcoin continues higher, that area could become the next short term target.
However, the chart also shows another support zone below the current move near the $69,000 to $71,000 area. If $BTC fails inside the weekly FVG, that lower zone could return to focus.
For now, Bitcoin has reached an important resistance area. A move through the FVG could open the path toward the $84,000 to $85,000 CME gap, while rejection would keep the recovery structure under pressure.

 coinpaper.com