
Bitcoin is testing short-term resistance near $77,279 while traders also watch the monthly close above $74,434. A breakout could support another move toward $80,000, but a weak close would keep pressure on the downside.
Bitcoin Tests Micro Resistance as $BTC Watches $77,279 Breakout Level
Bitcoin is trading near $76,513 on the 30-minute chart after bouncing from the short-term support area near $75,910.
The chart shared by MCO Global DE shows a micro resistance zone for orange wave 4 between $76,673 and $77,279. This area matches the 38.2%, 50%, and 61.8% retracement levels marked on the chart.
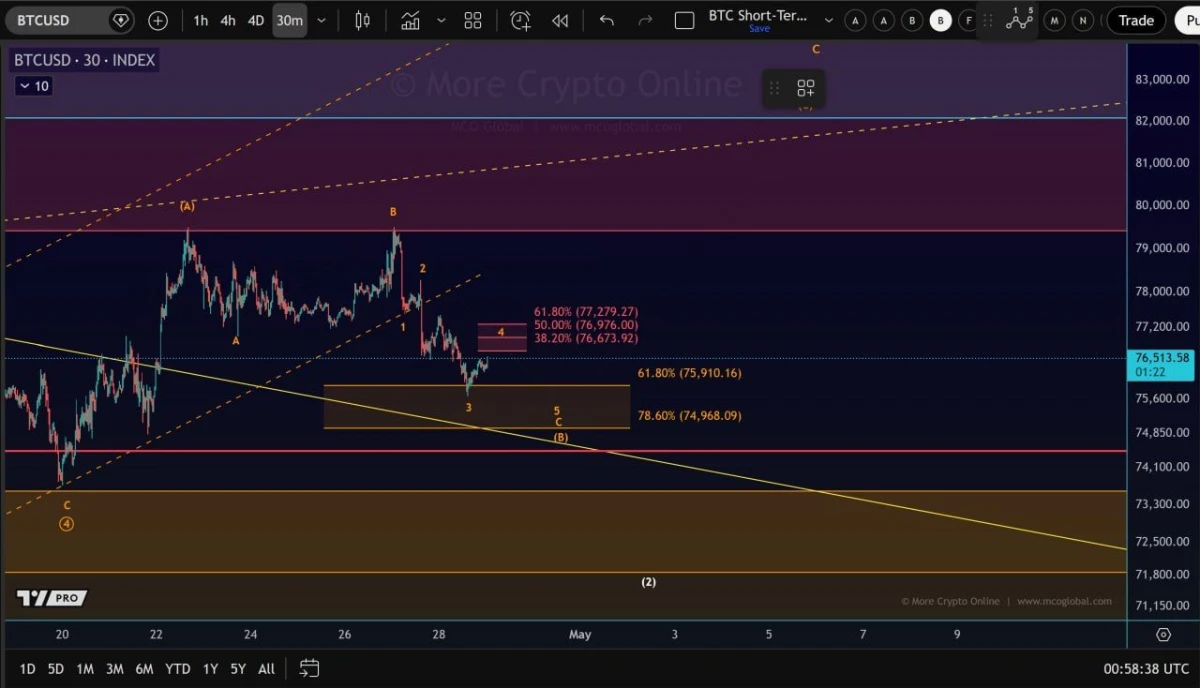
$BTC 30-Minute Chart. Source: MCO Global DE on X
MCO Global DE said wave C may be forming as a diagonal structure on the downside. That means wave 4 could still extend toward the 61.8% retracement at $77,279 before Bitcoin decides its next move.
The lower support zone sits around $75,910 and $74,968, based on the 61.8% and 78.6% levels shown on the chart. Bitcoin already bounced from that area, which makes it the first zone to watch if sellers return.
A strong breakout above the micro resistance zone could suggest that Bitcoin has already formed a local bottom. In that case, $BTC would need follow-through above $77,279 to weaken the short-term bearish structure.
However, failure near the resistance zone would keep pressure on the downside. If $BTC rejects from $76,673–$77,279, the chart keeps focus on $75,910, then $74,968 as the next support levels.
Bitcoin Monthly Close Puts $74,434 Level in Focus
Bitcoin’s monthly chart is centered on the $74,434 level, which Ted Pillows marked as the key line bulls need to reclaim.
The chart shows $BTC trying to recover after a sharp pullback from the higher range. A monthly close above $74,434 would keep the bullish case alive and could open the way toward the $80,000 area, according to the post.
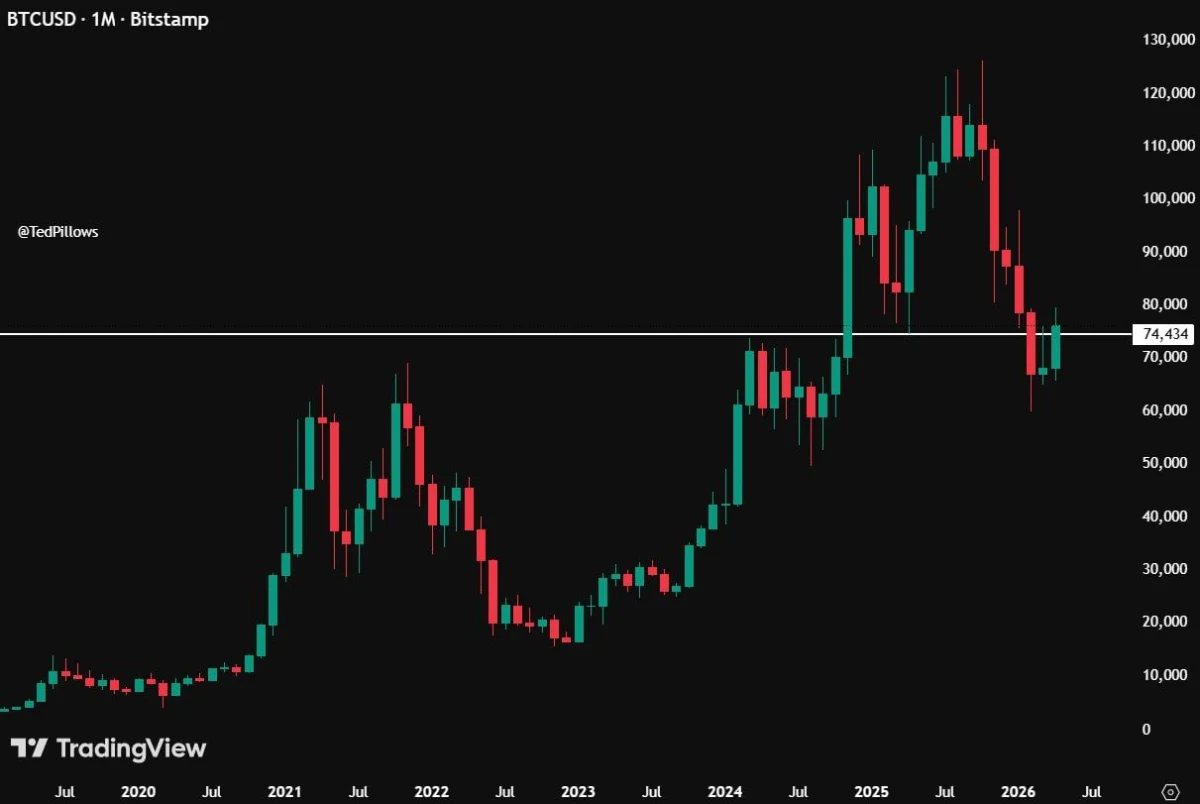
$BTC Monthly Chart. Source: Ted Pillows on X.
However, a monthly close below that level would weaken the recovery setup. In that case, Ted Pillows said the earlier move to $79,500 was likely the local top.
The level matters because it sits near the middle of Bitcoin’s recent monthly structure. Holding above it would show that buyers still have control after the correction.
A close below it would show weaker demand and keep pressure on the downside. Therefore, the monthly close becomes the main signal to watch.