
Bitcoin is currently navigating in a improving, market structure, avoiding a potentially more serious corrective phase. $BTC has finally established a short-term recovery trend, rising back toward the $77,000 range and exhibiting indications of stabilization after months of persistent downward pressure.
Bears are losing control
Technically speaking, things were on the verge of getting worse. A distinct downward trend characterized earlier price action, with Bitcoin still in the downtrend. But there has been a change in momentum recently. After regaining its short-term moving averages, Bitcoin is now making an effort to stay above them, creating a series of higher lows, which is a crucial early indication that bearish control is eroding.
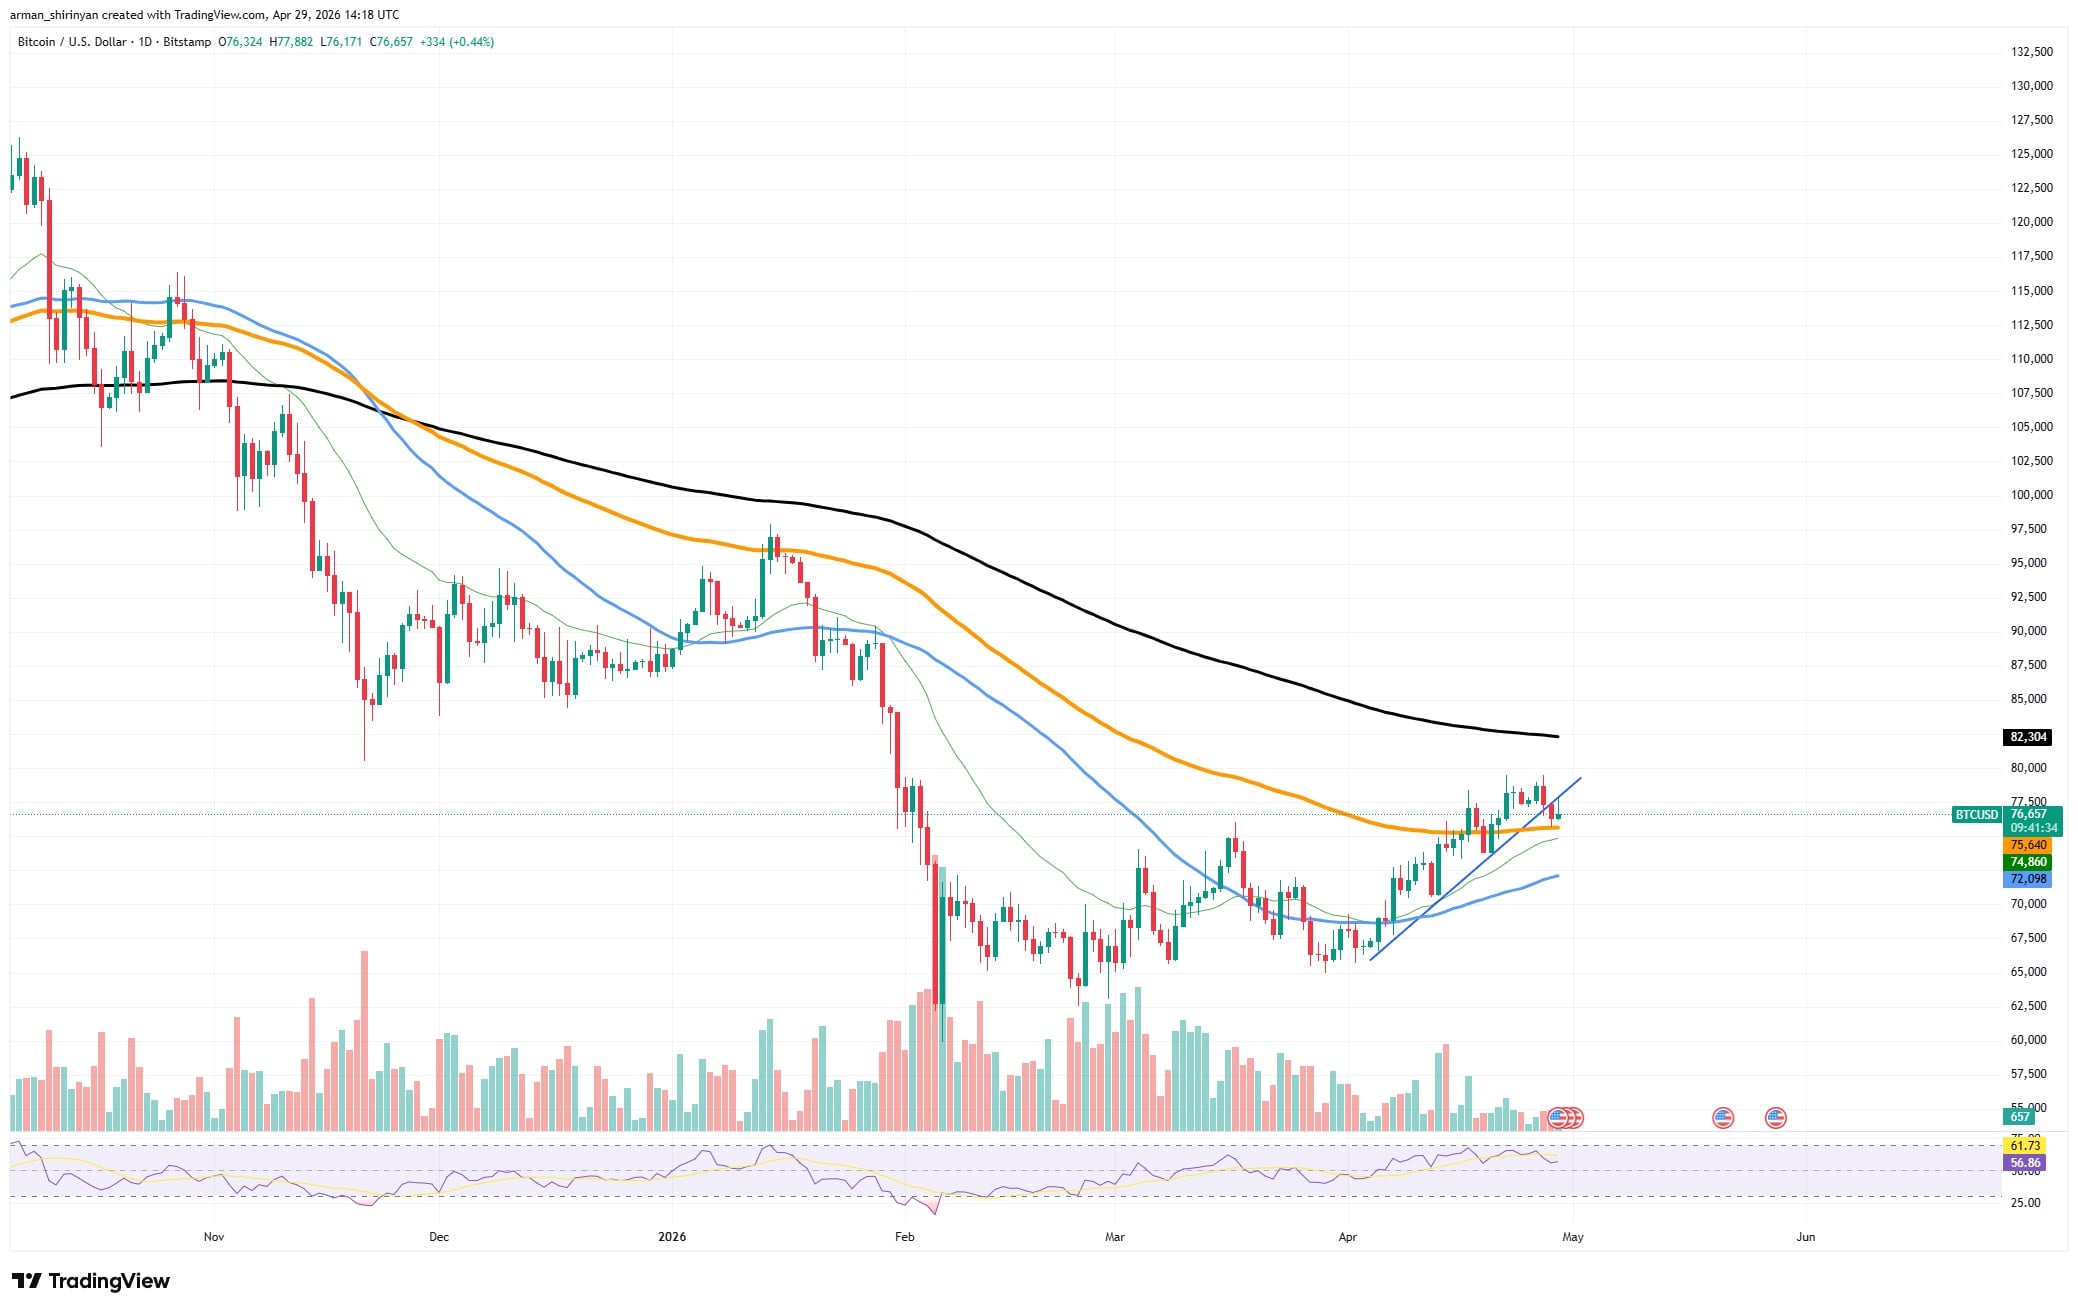
The ascending structure that has developed over the last few weeks is what is most noticeable. This slow rise implies that buyers are taking advantage of dips rather than holding out for more substantial discounts. Even though the volume isn't particularly strong, it does support the move sufficiently to show real participation, as opposed to a purely speculative bounce.
A possible breakdown below the mid-$60,000 range, which might have started a chain reaction toward much lower levels, was the catastrophe that Bitcoin managed to avert. Rather, selling pressure was absorbed by the market, which reversed before that point. Even though general sentiment is still cautious, this resilience shows that underlying demand is still present.
Nevertheless, normalization is not entirely verified. The 200-day moving average, which continues to serve as dynamic resistance above, is one of the longer-term trend indicators that Bitcoin is currently trading below. The recovery should be viewed as tentative rather than definitive as long as Bitcoin stays below that threshold.
The market may progressively move into a more neutral phase if the present momentum continues, possibly laying the groundwork for a more extensive recovery. But if the current structure is not maintained, especially if it drops below recent higher lows, the bullish case would be swiftly refuted and downside risk would be reopened.
Dogecoin finally wakes up
Dogecoin has finally produced the move that many traders had been anticipating: a dramatic breakout that essentially removed a zero from its price structure. $DOGE pushed above the $0.10 area with a powerful impulse candle, following weeks of compression and gradual accumulation, confirming a bullish continuation setup that had been developing for a while.
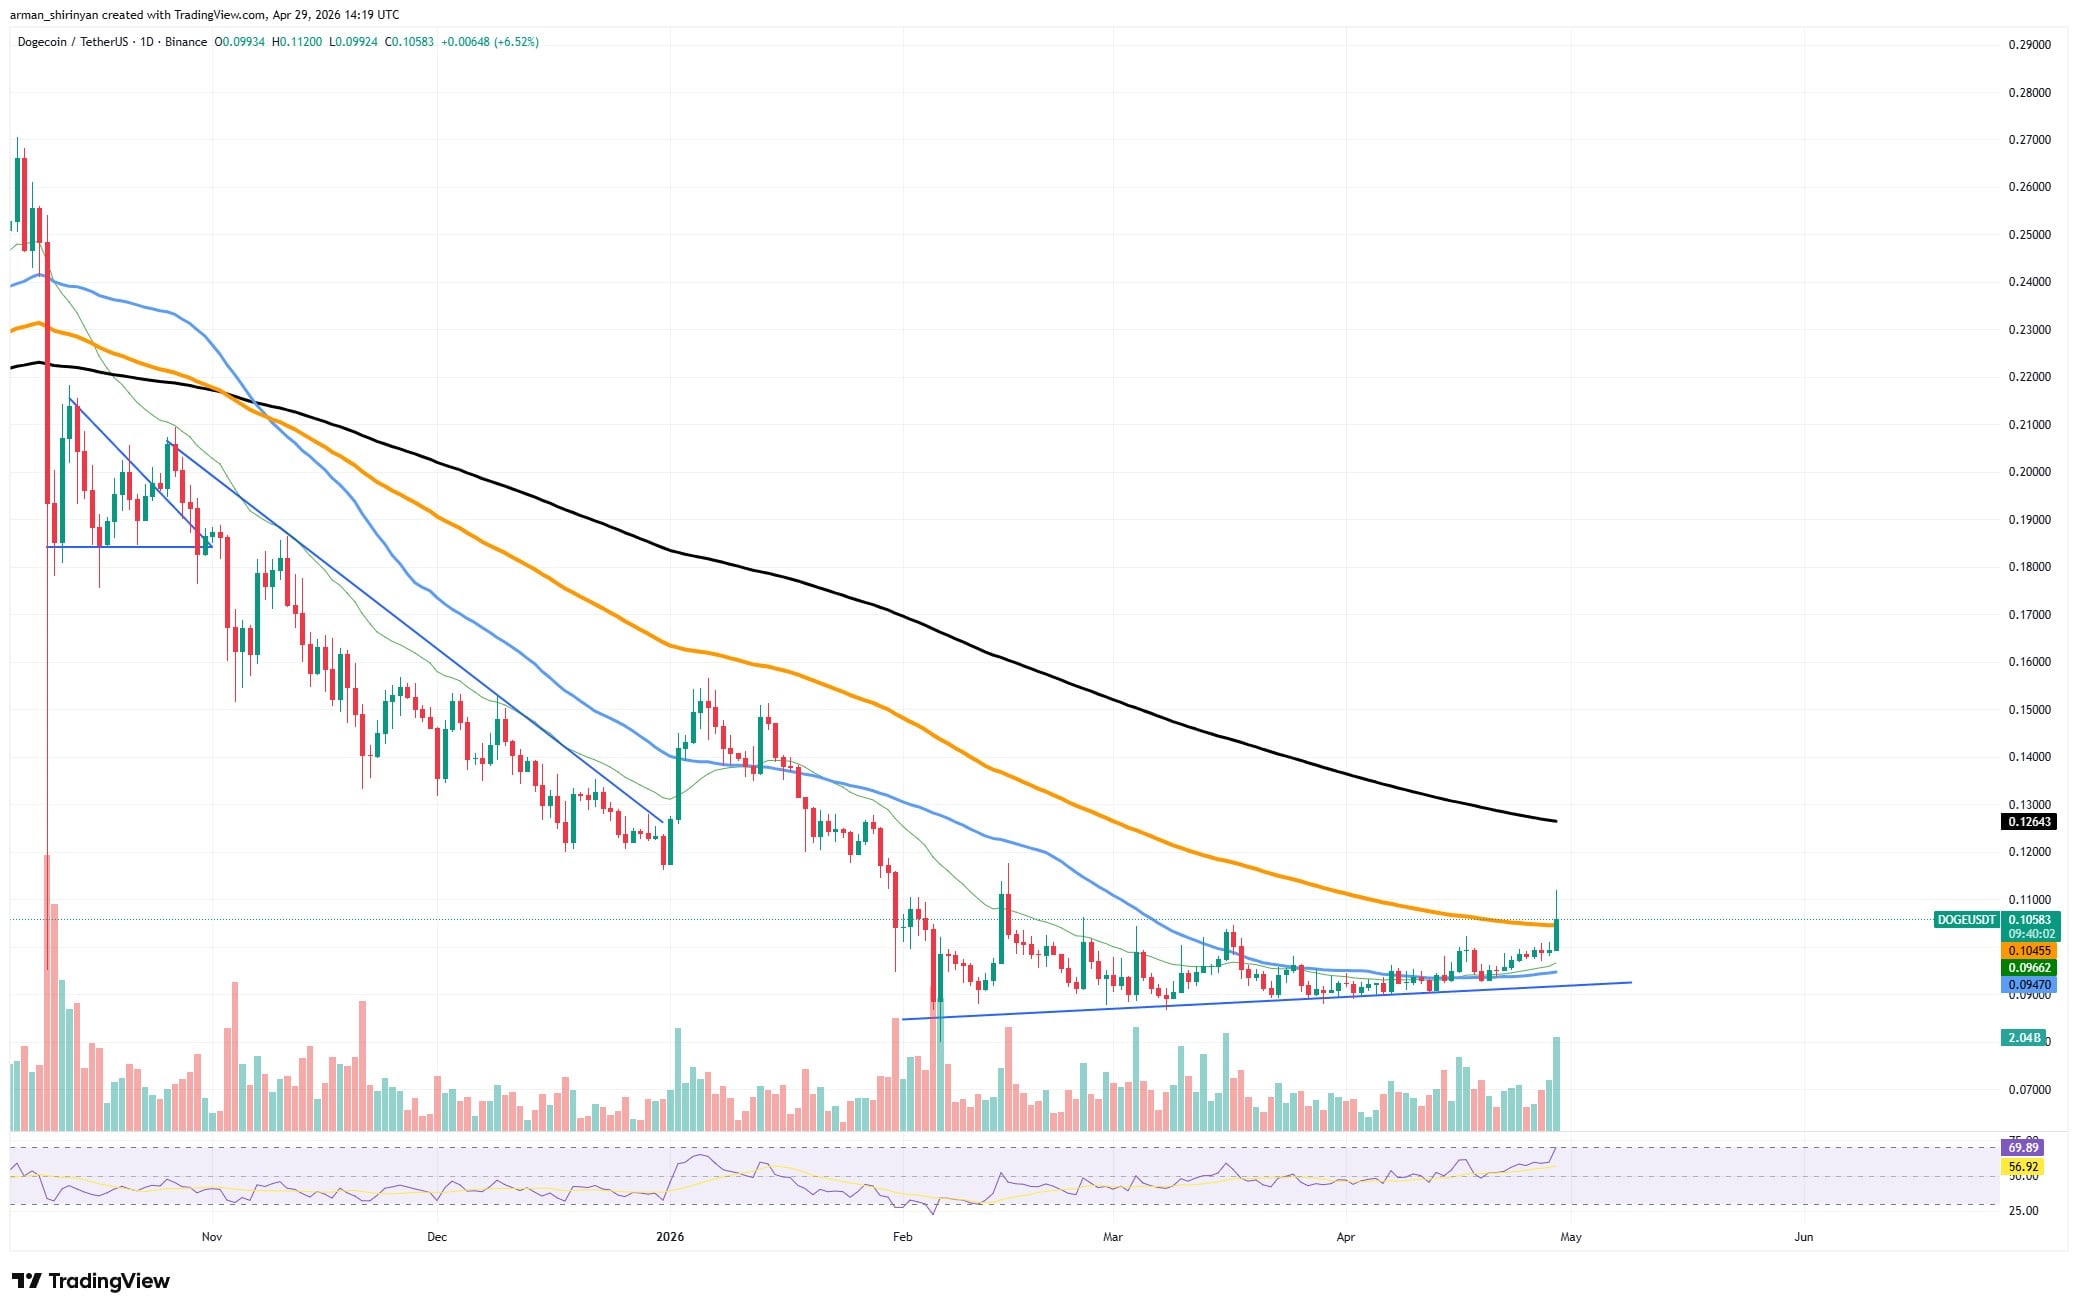
This move wasn't made at random. A distinct base formation and a steadily rising support line are visible on the chart, suggesting steady buyer interest on dips. When $DOGE got close to the psychological $0.10 barrier, there was less liquidity above it, which made it possible for the price to move swiftly after resistance was broken.
Momentum rotation within the broader cryptocurrency market is another significant factor. Capital started to move into higher-beta assets like Dogecoin, as Bitcoin stabilized and avoided further declines. By their very nature, meme coins amplify market sentiment, and $DOGE profited from this change more than most.
Volume verifies the breakout's validity. Rather than a low-liquidity spike, the increase in trading activity that coincides with the price move indicates genuine participation. Although it is now getting close to levels where a short-term cooling would be anticipated, RSI also moved into higher territory, indicating growing bullish momentum.
Sustainability is now the main concern. Dogecoin is still trading below its longer-term moving averages, especially the 200-day trend line, which is still overhead resistance, even though the breakout is technically legitimate. This indicates that, on a large scale, the current rally is still countertrending.
Zcash is suddenly bullish
With its shorter-term moving average about to cross above the long-term trend line, a configuration known as a golden cross, Zcash is nearing a technically significant moment. $ZEC's current market structure indicates that the situation is more complex than a simple breakout scenario, even though this signal frequently draws bullish attention.
Zcash has been steadily rebounding from its protracted decline, as evidenced by price action creating a modest ascending structure over the last few weeks. Holding above important mid-term moving averages and trying to create a higher-low structure, the asset recently moved toward the $330 range. The golden cross has come into play because of this steady ascent.
The upper boundary of a developing ascending channel appears to be interacting with $ZEC at the same time. Theoretically, a successful breakout above this resistance could lead to a continuation rally. Comparisons to Dogecoin's recent breakout are inevitable, but it would be unrealistic to expect a similar explosive move.
Momentum and market context are the main differences. Strong retail participation, speculative inflows, and an obvious volatility expansion phase all contributed to Dogecoin's surge. Conversely, Zcash is operating in a low-volume, more regulated environment. The aggressive participation usually needed for a parabolic move is not present in the current volume profile.
Furthermore, $ZEC continues to experience overhead pressure due to its longer-term trend structure. Even if the golden cross is confirmed, the 200-day moving average is still fairly close and may serve as dynamic resistance, limiting upside acceleration. In this situation, breakouts typically fade rather than continue in the absence of a significant increase in volume and wider market support.