The "Digital Gold" Divergence: Why Bitcoin Just Crashed
The relationship between Gold and Bitcoin has reached a fever pitch in 2026. Historically, these two assets have been viewed as siblings in the "store of value" category, but their recent price action tells a more complex story of liquidity rotation and market psychology.
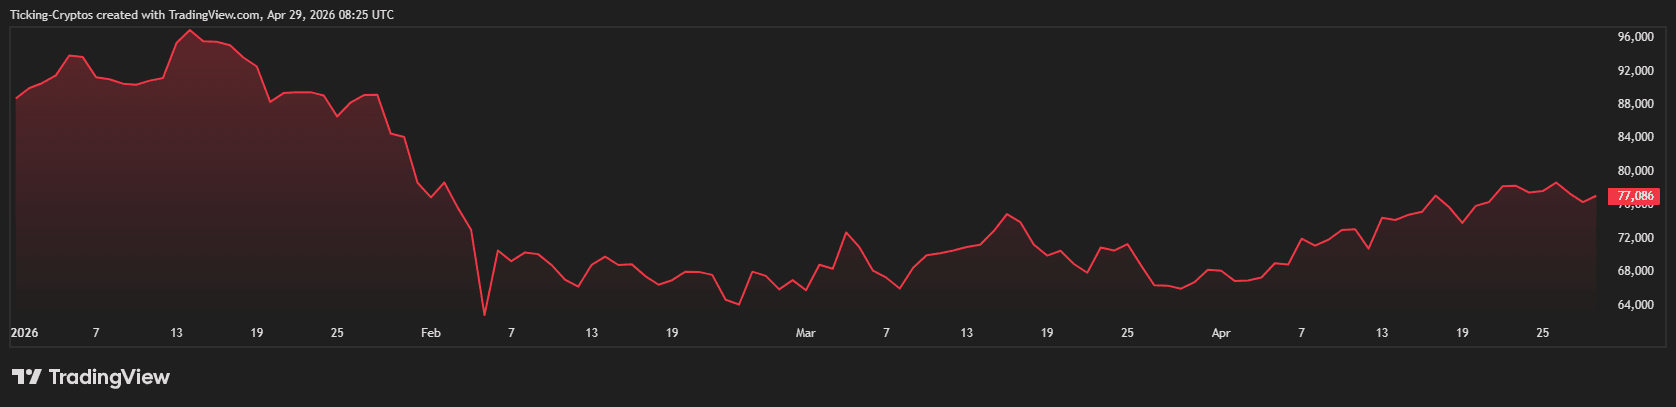
When Gold recently peaked at an all-time high of $5,589 per ounce on January 28, 2026, the crypto market didn't celebrate. Instead, Bitcoin [$BTC] experienced a sharp -33% correction, sliding toward the $81,000 mark. While this might look like a decoupling, historical cycles suggest this "shakeout" is often the precursor to an explosive bull run for digital assets.
Does Bitcoin Always Drop When Gold Peaks?
Not "always," but the correlation often turns negative at critical structural peaks. In August 2020, Gold hit what was then a record high, and Bitcoin immediately cooled off with a -21% retracement. Fast forward to January 2026, and we see a similar script: Gold reaches a parabolic peak, and Bitcoin sheds roughly a third of its value.
The pattern indicates that at the height of a Gold rally, liquidity is often "tapped out" or moving into defensive postures before rotating back into higher-risk, higher-reward assets like $Bitcoin.
Comparing the 2020 and 2026 "Gold Peaks"
To understand where we are going, we have to look at where we’ve been. The current market structure bears a striking resemblance to the 2020 cycle.
| Metric | 2020 Gold Peak Cycle | 2026 Gold Peak Cycle |
|---|---|---|
| Gold Peak Date | August 2020 | January 2026 |
| $BTC Immediate Drop | -21% | -33% |
| Recovery Catalyst | Stimulus & Halving Lag | Institutional ETF Flows |
| Post-Peak $BTC Gain | +559% (238 Days) | TBD (Projected Highs) |
The Liquidity Rotation Theory
In finance, "Liquidity Rotation" refers to capital moving from one asset class to another. When Gold reaches a "blow-off top" (a rapid increase in price followed by a steep drop), investors often take profits. That "sideline cash" doesn't stay idle for long. In 2020, that capital flowed directly into the crypto market, fueling a 559% rally that took $BTC from $11,000 to over $60,000 in less than a year.
Why the -33% Bitcoin Drop Matters Now
The 2026 drop has been more severe (-33% vs -21%) due to the increased presence of institutional leverage and Spot Bitcoin ETFs. However, the fundamental "why" remains the same:
- Profit Taking: Investors hedging with Gold and $BTC simultaneously often sell the "winner" (Gold) and reduce exposure to the "volatile" ($BTC) during a macro shift.
- Margin Calls: When Gold fell nearly 10% in a single day in late January, it forced liquidations across multi-asset portfolios, dragging $BTC down with it.
- The "Spring" Effect: Much like a compressed spring, Bitcoin's deep corrections during a secular bull market often provide the necessary energy for the next leg up.
Strategic Positioning: Is the Bottom In?
Analysts suggest that the current Bitcoin/Gold valuation is at historic lows. This typically marks a "generational bottom" for the Bitcoin-to-Gold ratio. If the 2020 fractal repeats, the -33% drop we just witnessed is the final hurdle before Bitcoin targets the $150,000 - $200,000 range.
What to Watch Next
- The $80,000 Support: $BTC must hold this level to validate the "2020-style" recovery.
- Gold Consolidation: If Gold continues to bleed toward $4,500, expect $BTC to start outperforming as the "risk-on" alternative.
- ETF Inflows: Watch for a reversal in ETF outflows, which peaked at $800 million during the January crash.