cryptopotato.com

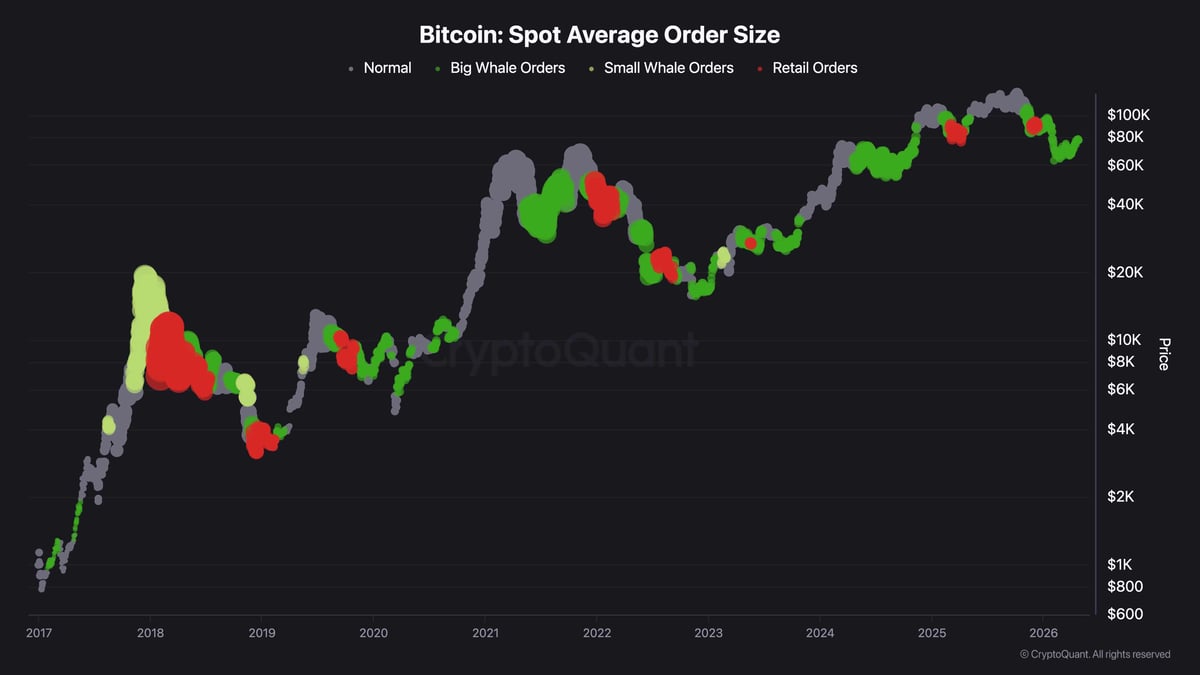
Bitcoin is trading around $76k as April draws to a close. It is sitting at one of the most technically loaded junctures of its entire corrective phase. After clawing back from the February low near $60k, $BTC has quietly rebuilt momentum through the mid-$70ks, and with whale-sized spot accumulation now clustering at current levels, the market is asking a pointed question: is the correction that defined Q1 2026 finally over?
Bitcoin Price Analysis: The Daily Chart
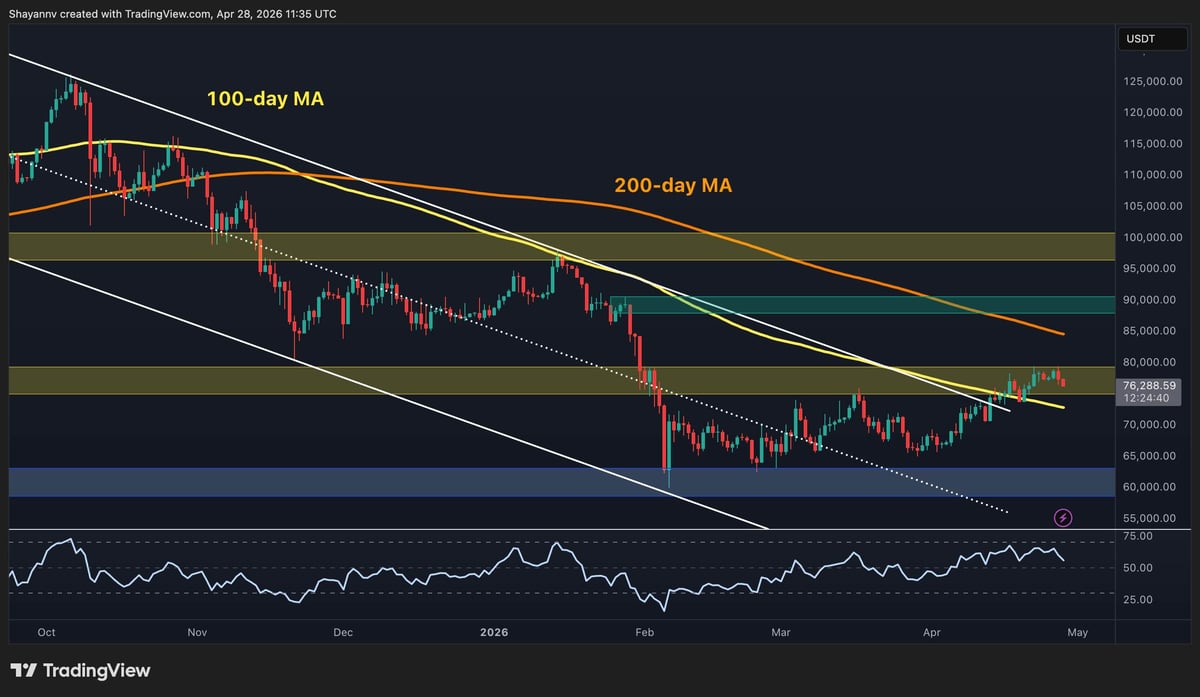
On the daily timeframe, Bitcoin has broken above the upper boundary of the descending channel that has been in place since the cycle peak above $120k in late 2025. The declining 100-day moving average, sitting around $72k–$73k, has also been broken, making a confluence of two major support elements below the current price. The RSI has also been hovering above 50 but is yet to show an overbought signal, suggesting bullish momentum is gradually building.
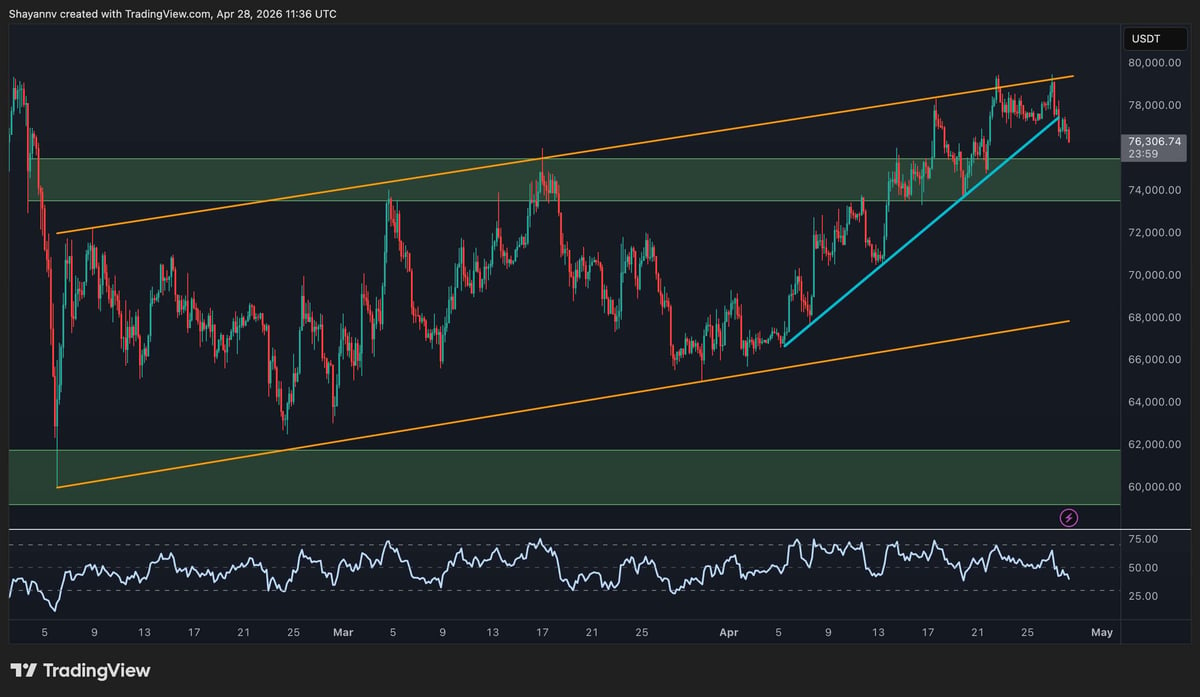
A clean daily close above the key $80k resistance level is the structural requirement for the market to shift the bias. The 200-day moving average declining around $85k represents the next major overhead barrier should the breakout materialize. Yet, a rejection from the $80k level and a daily close below $72k would put the ascending structure at risk and refocus attention on the $60k–$62k demand zone.