
$BTC is up 0.25% on April 16, and the recent rally has hit a wall. Holders just locked in $1.14B in profits in a single session, the descending channel boundary sits overhead at $75,266, and the 100-day EMA is at the exact same level.
$BTC Daily Chart: Channel Boundary And 100-Day EMA Both At $75,266
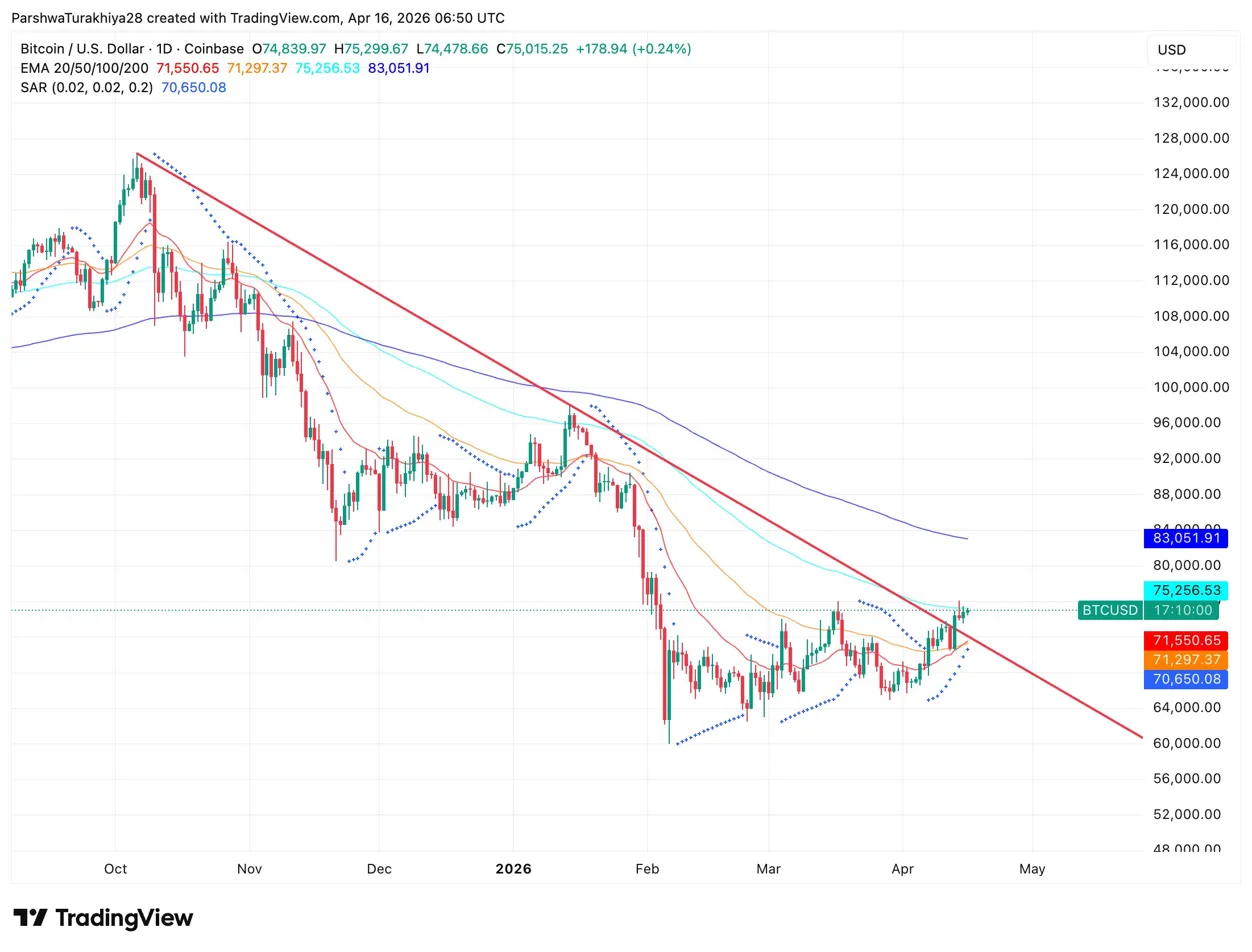
The descending channel from the October peak near $128,000 defines the whole chart. $BTC has rallied nearly 10% this month from the February low near $62,000, pressing into the channel’s upper boundary near $75,000 to $76,000 where the 100-day EMA at $75,266 sits at the same level, making both resistance layers overlap.
The 20-day EMA at $71,550 and 50-day at $71,297 have crossed below price and act as support. The SAR at $70,650 adds a third layer below. A daily close above $75,266 clears the channel and 100-day EMA at once, with the 200-day EMA at $83,051 as the next target. Losing the 50-day at $71,297 puts the SAR at $70,650 in play, then the February low near $62,000.
Key levels for April 17:
- SAR support: $70,650
- 50-day EMA: $71,297
- 20-day EMA: $71,550
- Channel boundary / 100-day EMA: $75,266
- 200-day EMA: $83,051
- February low: $62,000
Why Is $BTC Stalling At $75,000?
On-chain data from CryptoQuant shows the 30-day EMA of the Realized Profit/Loss Ratio at 1.16, confirming holders are selling into strength. On Tuesday, as $BTC briefly touched $76,000, investors locked in $1.14B in realized profits in a single session. CryptoQuant analysts put the number that matters at $78,100, stating a sustained move above that level requires the market to absorb the overhead supply first.
Related: Chainlink Price Prediction: SIX Exchange Puts €2T In Equities Onchain as LINK Tests $9.153
Spot demand is uneven. Buyers are aggressive on Binance but not on Coinbase or other venues, per Glassnode. Funding rates stay slightly negative, meaning traders are not leaning long yet. Deribit options show a put bias across all timeframes. Giottus CEO Vikram Subburaj put it directly: the market is consolidating, not overheating.
Bitcoin ETFs Pull $186M On April 15 As BlackRock Leads Again
Bitcoin spot ETFs recorded $186.03M on April 15, led by BlackRock’s IBIT at $291.86M and Morgan Stanley’s MSBT at $19.32M. Fidelity’s FBTC saw an outflow of $47.35M and Ark’s ARKB lost $42.22M.
Total net assets sit at $97.57B, 6.51% of Bitcoin’s market cap. The $186M follows $411.50M on April 14, confirming institutional demand stays active at current levels despite the profit-taking pressure.
$BTC Price Prediction: April 17 Outlook
- Upside: Daily close above $75,266 clears the channel boundary and 100-day EMA together. ETF inflows staying above $200M per day signals institutions are absorbing the profit-taking supply. CryptoQuant’s $78,100 threshold is the level that confirms overhead supply has cleared, with the 200-day EMA at $83,051 as the target beyond that.
- Downside: Profit-taking continues at $75,000, channel boundary holds, and $BTC slips toward the 50-day EMA at $71,297. Funding rates staying negative and the Deribit put bias sustaining points to the consolidation extending. A daily close below the SAR at $70,650 opens the February low near $62,000.
Related: Pepe Price Prediction: PEPE Jumps 5% as OKX Brings Regulated EU Derivatives & MACD Flips Positive