
Rekt Capital, a widely followed analyst in the cryptocurrency markets, has made noteworthy assessments regarding the technical outlook and possible scenarios following the recent rise in Bitcoin.
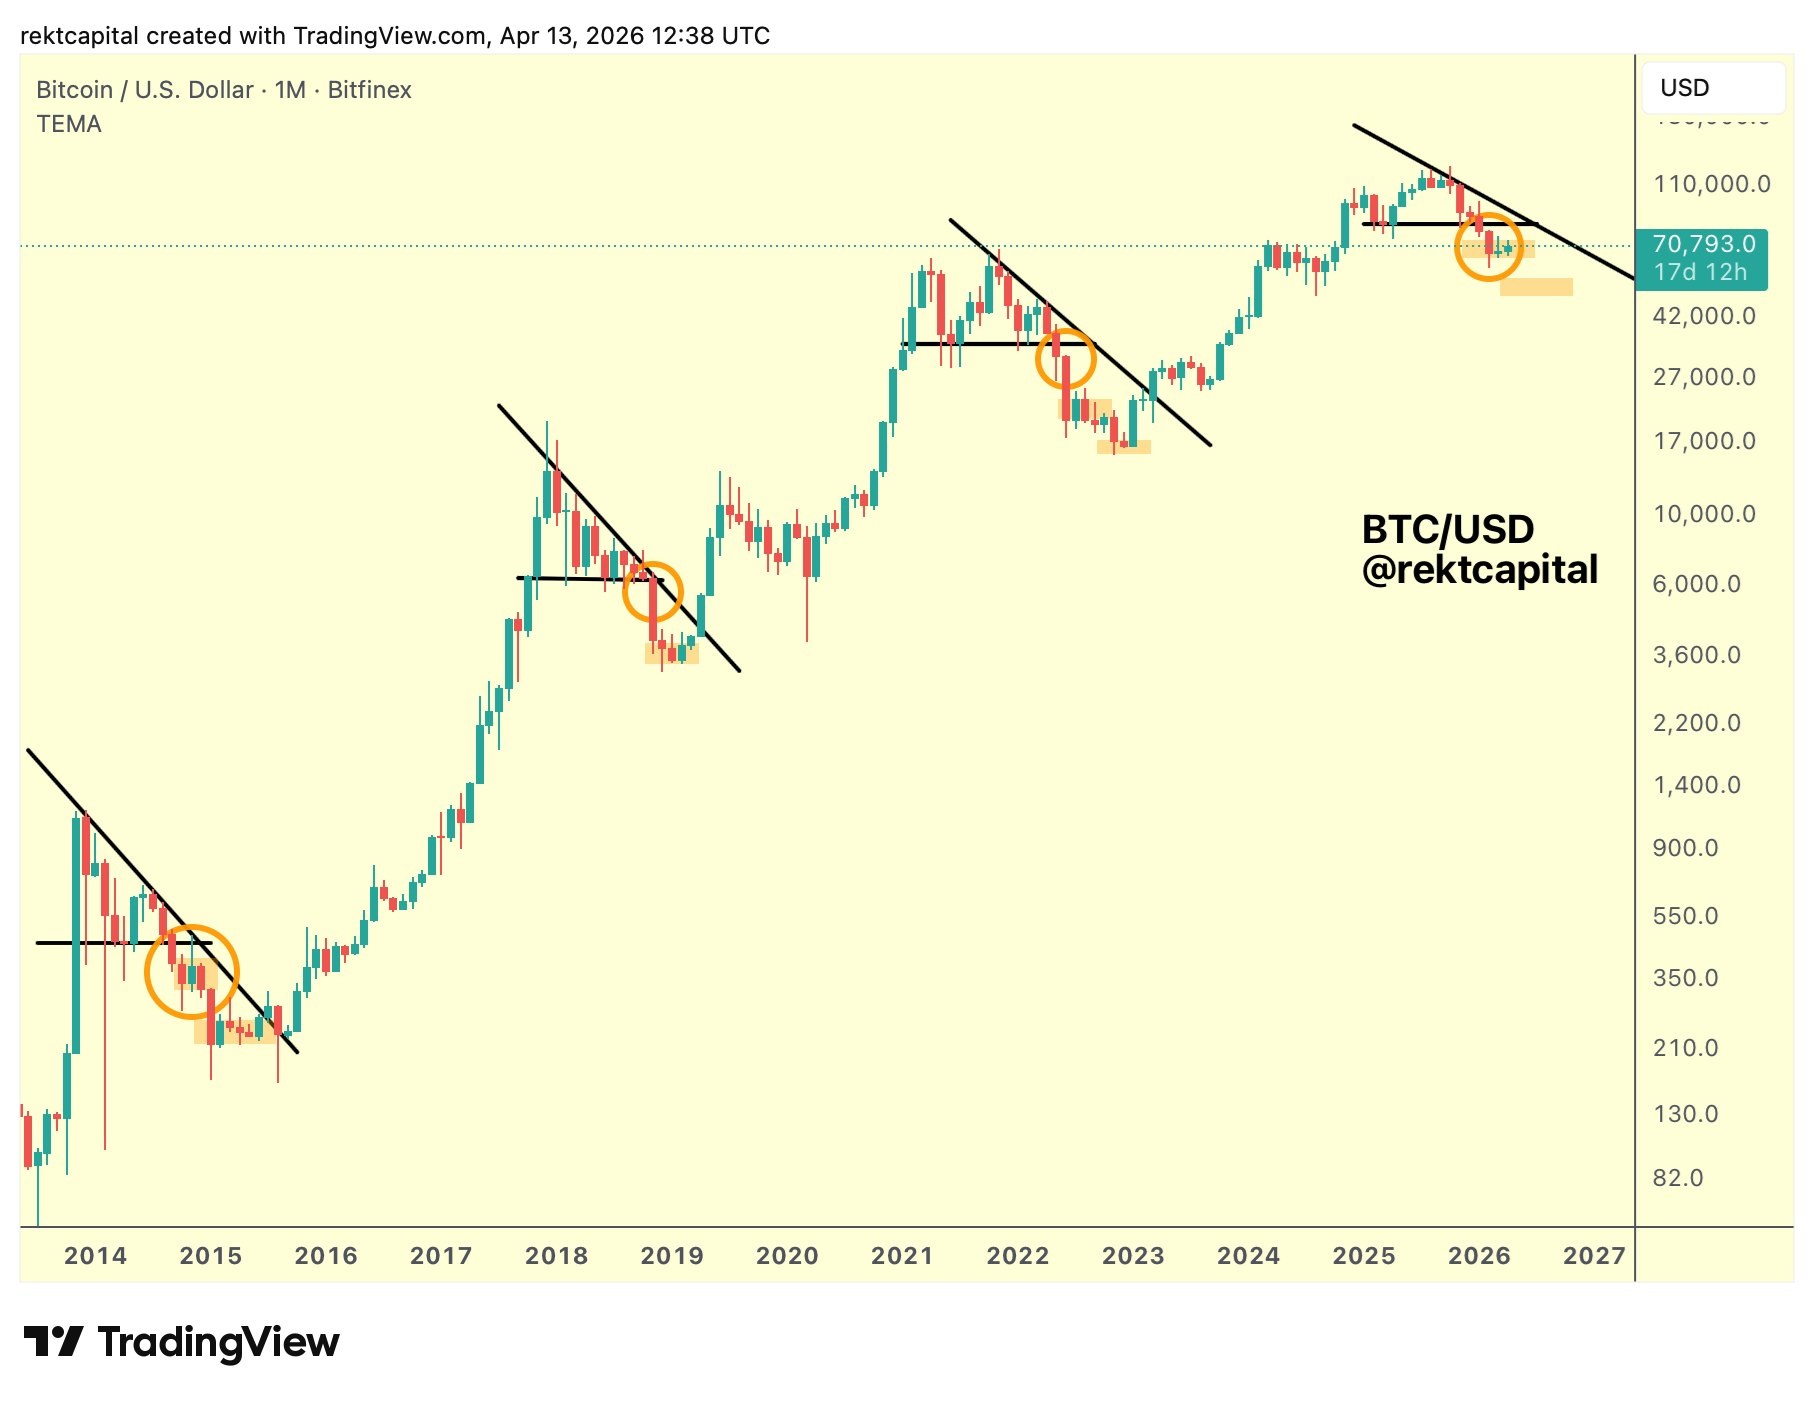
According to the analyst, when Bitcoin breaks downwards from “Macro Triangle” formations in past cycles, it generally tends to retrace towards a bear market bottom over time. However, the way this process works differs in each cycle. Rekt Capital points out that the price experienced rapid and sharp declines after these breakouts in 2018 and 2022, noting that the current cycle differs from these examples.
According to Rekt Capital, the current price movement closely resembles the 2014 cycle. During that period, Bitcoin experienced a long period of horizontal consolidation below the triangle formation. The analyst suggests that if a similar scenario continues, the Bitcoin price may move sideways for some time, with approximately $82,500 acting as a strong resistance (upper limit).
On the other hand, the analyst adds that Bitcoin typically forms large consolidation zones following macro triangle breakouts. Recalling that in the 2018 and 2022 cycles these consolidations occurred directly at bear market bottoms, Rekt Capital notes that in 2014, two separate consolidation processes took place: the first after the breakout, and the second at the final bottom.
If this historical pattern repeats, the analyst suggests that the current consolidation process may not be complete yet, indicating that a further downward move in Bitcoin is possible and that the main strong consolidation zone could form later, near the bear market bottom.
*This is not investment advice.