
$BTC trades at $72,896 on April 11, holding inside a rising 30-minute channel while the daily sits above three EMAs and spot ETFs post back-to-back inflow days worth $598M combined.
$BTC Daily Chart: $74,000 Is The Only Level That Matters
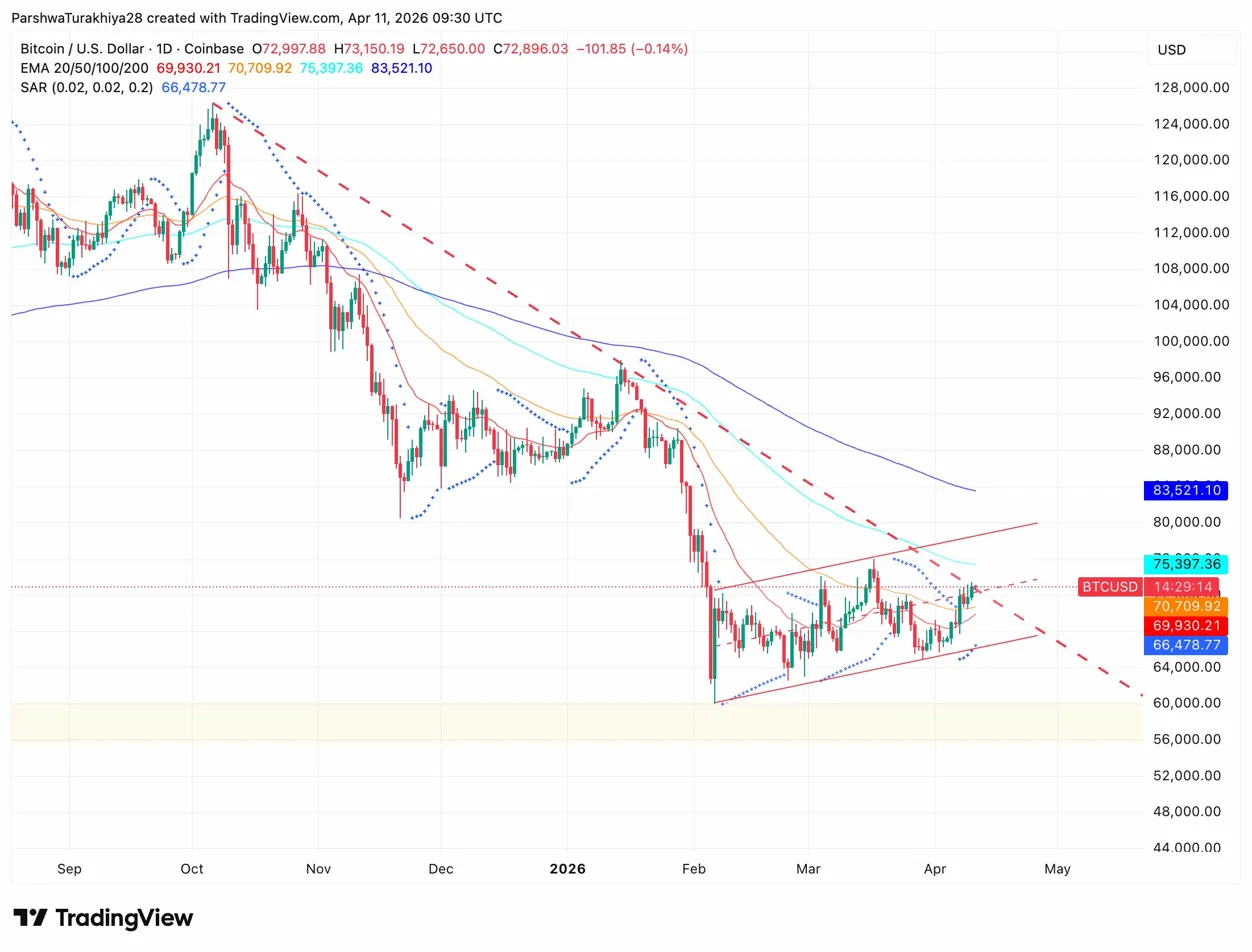
The 20-day EMA at $69,930 and 50-day at $70,709 have crossed below price and now act as support. The SAR at $66,478 sits further below. Above, the 100-day at $75,397 and 200-day at $83,521 remain as resistance.
The ascending wedge from the February low at $60,000 has price pressing into its upper boundary near $73,000 to $74,000, the same zone where the descending channel from October caps the rally. Two resistance lines at the same level make a daily close above $74,000 the trigger for the next leg up. Losing the 50-day at $70,709 on a daily close puts the SAR at $66,478 in view.
Key levels for April 12:
- SAR support: $66,478
- 20-day EMA: $69,930
- 50-day EMA: $70,709
- Resistance zone: $73,000 to $74,000
- 100-day EMA: $75,397
- 200-day EMA: $83,521
- February low: $60,000
$BTC 30-Min Chart: Rising Channel Intact With MACD Turning Positive
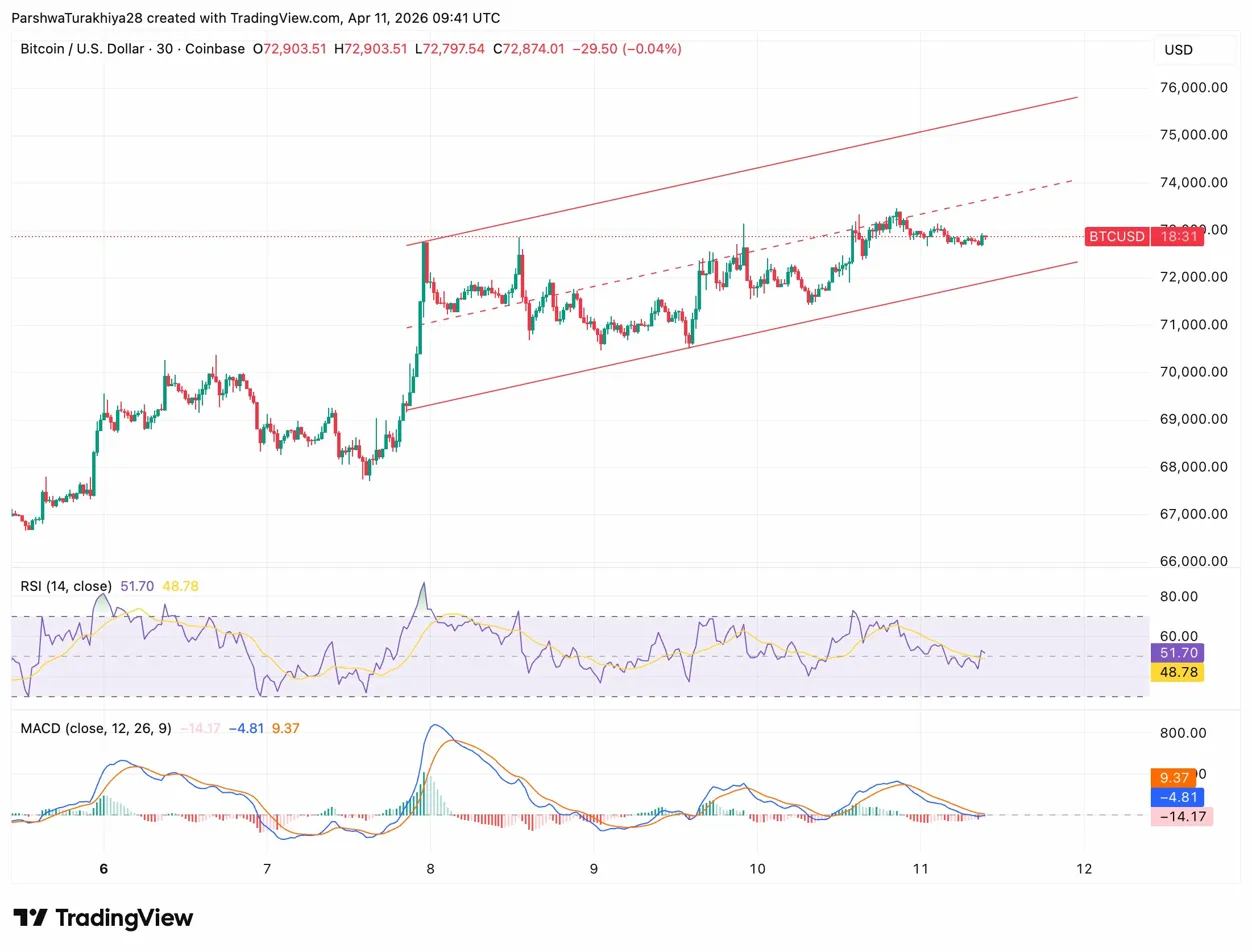
The 30-minute chart shows a clean rising channel from the April 8 low near $67,000, with each pullback holding above the prior low through April 9, 10, and 11. Price sits near the channel midline at $72,896, upper boundary near $75,000 to $76,000, lower boundary near $71,500.
RSI at 51.70 sits just above the signal line at 48.78, leaning bullish but not extended. The MACD histogram is positive at 9.37 with the fast line still below zero, meaning momentum is building without full confirmation yet. Holding above $71,500 keeps the short-term structure intact. Losing it shifts focus back to the daily EMAs.
Bitcoin ETF Inflows: Two Straight Days, $598M Combined
After outflows of $124.55M and $159.05M on April 7 and 8, ETFs flipped to $358.17M on April 9 and $240.42M on April 10. BlackRock’s IBIT led April 10 with $137.56M, Fidelity’s FBTC added $78.02M. Total net assets sit at $94.96B, 6.47% of Bitcoin’s market cap.
The two inflow days aligned with $BTC’s move from $68,000 to $73,000, confirming institutions bought the dip rather than chased the rally.
$BTC Derivatives: Shorts Take Five Times More Pain Than Longs
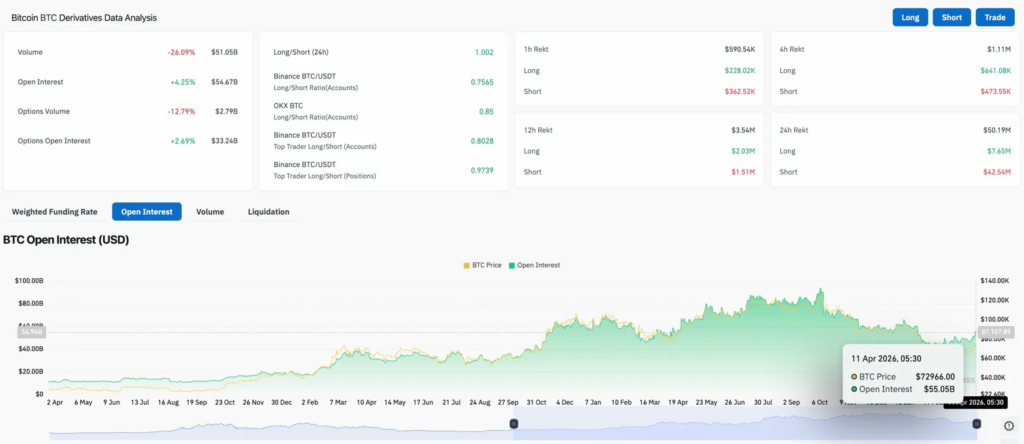
Volume fell 26.09% to $51.05B while OI rose 4.25% to $54.67B. Positions are holding, not building. Long/short ratio at 1.002 is flat, with Binance accounts short-biased at 0.7565 and OKX at 0.85.
Shorts absorbed $42.54M in 24-hour liquidations against $7.65M for longs. Options OI rose 2.69% to $33.24B, the second straight day of expansion as $BTC presses into resistance.
$BTC Price Prediction: April 12 Outlook
- Upside: 30-min channel holds above $71,500, daily closes above $73,000 to $74,000, and the next target is the 100-day EMA at $75,397. ETF inflows staying above $200M per day keeps the institutional bid in place.
- Downside: Channel breaks below $71,500, 50-day EMA at $70,709 gives way, and the SAR at $66,478 becomes the next test. A close below $66,478 opens the February low at $60,000.