
$BTC trades at $71,666 on April 10, pressing into the descending channel’s upper boundary for the first time since October as $358M in ETF inflows land alongside trader caution over whether the Iran ceasefire survives the weekend.
$BTC Daily Chart: Channel Upper Boundary Meets The Supertrend At $74,017
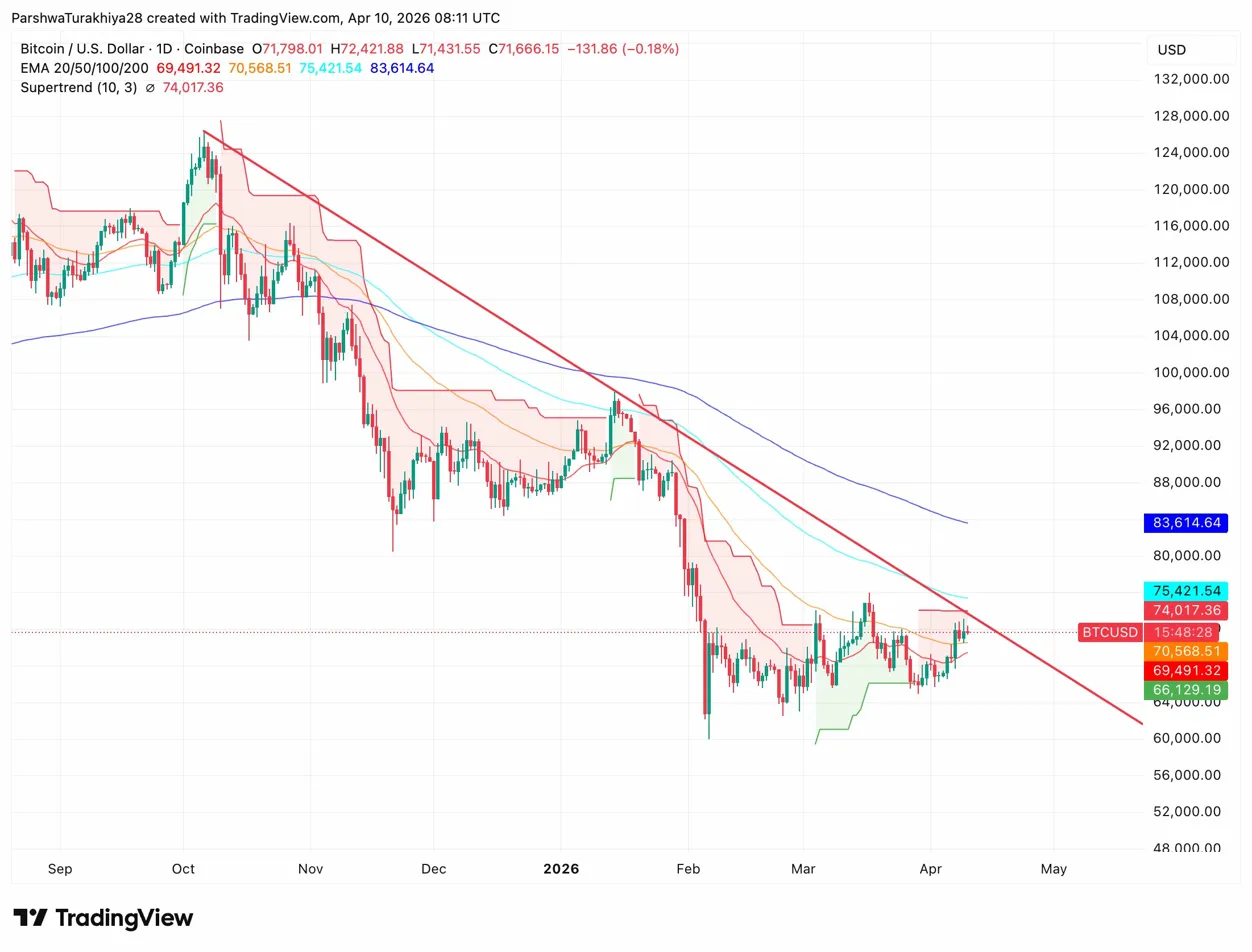
The descending channel from the October peak near $128,000 has held every rally for six months. This week’s 8% move pushes price directly into the upper boundary for the first time. The Supertrend at $74,017 sits just above, forming a tight resistance cluster between $72,000 and $74,017 that has not been tested from below until now.
Related: Dogecoin Price Prediction: Polymarket Splits 50/50 On DOGE Hitting $0.10 In April
The 20-day EMA at $69,491 has crossed below price and now acts as support, the first time that has happened since November. The 50-day at $70,568 sits just below as a second support layer. Above the Supertrend, the 100-day EMA at $75,421 is the next test, then the 200-day at $83,614. A daily close above $74,017 breaks both the channel and Supertrend in the same candle. Losing $69,491 on a daily close puts the February low near $63,000 back in view.
Key levels for April 11:
- 20-day EMA support: $69,491
- 50-day EMA support: $70,568
- Channel upper boundary: $72,000 to $73,000
- Supertrend resistance: $74,017
- 100-day EMA: $75,421
- 200-day EMA: $83,614
- February low: $63,000
Bitcoin Spot ETF Inflows Hit $358M On April 9, BlackRock Leads
April 9 saw $358M flow into Bitcoin spot ETFs, the strongest single-day inflow of the month. BlackRock’s IBIT took in $269.34M, Fidelity’s FBTC added $53.33M, and Franklin’s EZBC contributed $2.08M. Total net assets across all products sit at $93.24B, 6.43% of Bitcoin’s market cap.
The timing matters. April 7 and 8 saw combined outflows of $283M as the ceasefire uncertainty peaked. The $34M reversal on April 9 came the same day the US-Iran truce was announced, making it the clearest signal yet that institutional demand returns when geopolitical risk eases.
Iran Ceasefire: Why Bitcoin Traders Are Not Fully Convinced Yet
The US-Iran conditional truce triggered $BTC’s 8% weekly rally, but Bybit chief market analyst Han Tan warns the ceasefire remains on shaky ground. The Strait of Hormuz, which carries roughly a fifth of global oil and LNG supply, is still largely shut since the US and Israel struck Iran on February 28. A temporary halt on strikes does not change the inflation outlook or shift monetary policy until the Strait actually reopens.
Related: Cardano Price Prediction: Hoskinson Fires Back At XRP as ADA Holds $0.2475
US and Iranian officials meet in Pakistan on Saturday with shipping access as the central issue. Kuwait separately reported drone attacks on facilities linked to Iranian proxy groups this week, keeping the risk of escalation alive heading into the weekend. Bybit’s data shows $56M in bearish positions liquidated during the rally with open interest rising and funding rates stable, pointing to fresh positioning rather than a short squeeze. Tan’s view: if the ceasefire breaks, risk assets give back most of their recent gains fast.
$BTC Price Prediction: April 11 Outlook
- Upside: Daily close above $74,017 breaks the channel and Supertrend together. Saturday’s Pakistan talks producing progress on Hormuz reopening removes the macro overhang. ETF inflows staying above $200M per day keeps institutional demand in place. First target above $74,017 is $75,421.
- Downside: Ceasefire collapses over the weekend, $BTC loses the 20-day EMA at $69,491, and the channel interior reopens. February low at $63,000 is the next floor.