
In brief
- Trump set an 8 p.m. ET deadline for Iran to reopen the Strait of Hormuz or face destruction.
- The move has rattled markets, with Bitcoin down 2% to $68,117 and a triple-pattern breakdown playing out on the daily chart.
- Prediction market traders on Myriad give $BTC a 57% chance of dumping to $55K.
War is the macro today.
President Donald Trump posted on Tuesday morning on Truth Social that "a whole civilization will die tonight, never to be brought back again" unless Iran gives in to U.S. demands. He set 8 p.m. ET as the hard deadline for Iran to reopen the Strait of Hormuz or face destruction.
pic.twitter.com/5qOokIQPuK
— Rapid Response 47 (@RapidResponse47) April 7, 2026
S&P 500 futures fell 0.4%, Nasdaq 100 futures dropped 0.6%, and Dow futures sank 142 points before the opening bell. Oil went the other direction: WTI crude is trading above $115 a barrel, Brent above $110—a more than 70% rise over the last 30 days—the direct result of a Strait of Hormuz closure that has been choking off roughly a fifth of the world's oil supply since late February.
There it is—Dated Brent (i.e., spot) crude hits $144.46/bbl, a new all-time high. pic.twitter.com/ZbyBzpTStQ
— Rory Johnston (@Rory_Johnston) April 7, 2026
Iran rejected a previous ceasefire proposal from the United States, and international groups such as the International Committee of the Red Cross have said Trump’s threats, if fulfilled, could amount to “war crimes.”
The escalation in rhetoric has markets on edge, and crypto is no different. Bitcoin slipped to $68,557, dropping 2% on the day, and Ethereum slipped 2.7% as traders apparently brace for further turmoil. The logic appears to be that if bombs start falling on civilian infrastructure tonight, investors will flee to safety—and Bitcoin has increasingly shown to not function as a safe haven asset during a war panic.
On Myriad, a prediction market built by Decrypt's parent company Dastan, traders are pricing in only a 24.1% chance that the Iranian regime falls before October. It suggests traders either expect yet another TACO move from Trump or believe the conflict will drag deep into the second half of the year, with no clean resolution in sight.
The Bitcoin chart has seen this movie before
With Bitcoin down around 2% today, the short-term movement doesn't look catastrophic—but the long-term picture isn’t pretty.
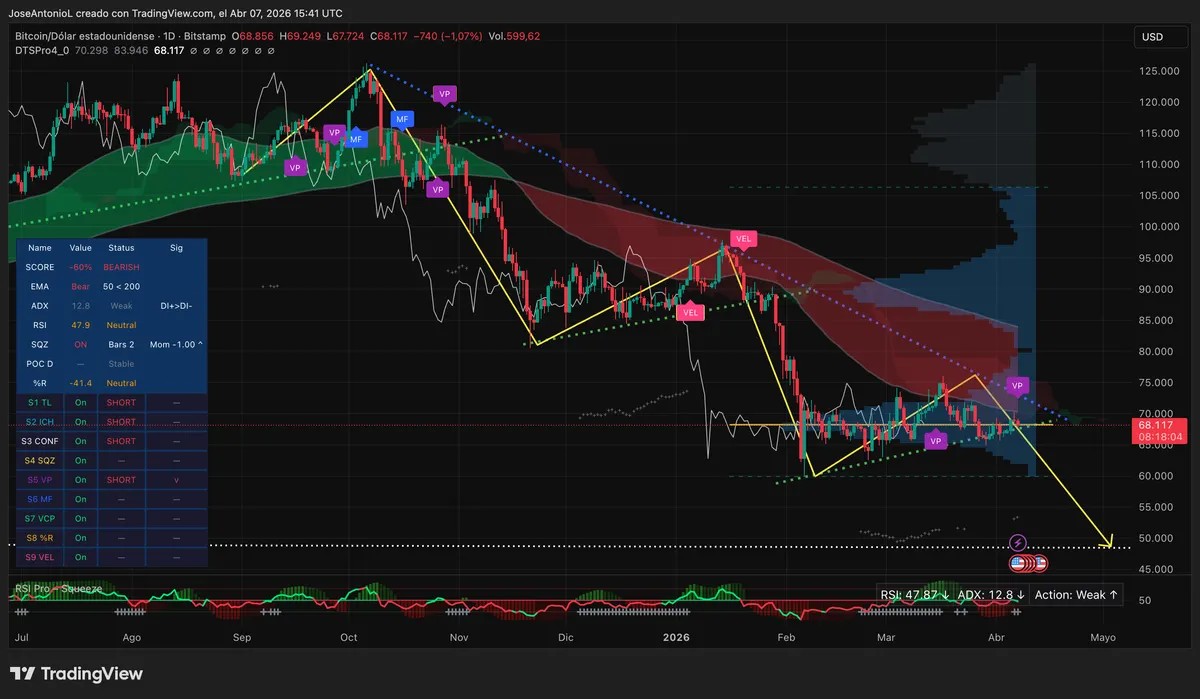
The daily charts show three separate attempts by buyers to recover losses after a major top, and three separate failures, since October of last year. Each recovery set a lower high. Each breakdown found a lower bottom. Bitcoin closed Q1 2026 with its worst quarter since 2018, down 22% as war, tariffs, and a hawkish Fed crushed risk appetite. The coin is now at the bottom of the third pattern, hovering above support near $65,000. If this plays out the way the previous two did, the next stop is $55,000 or worse.
The overall indicators show a bearish mood among Bitcoin traders.
The Exponential Moving Averages, or EMAs, show that the 50-day average is trading below the 200-day, which is the quintessential bearish indicator. It means the longer-term trend is still pointed down, and there's no structural reversal in the moving averages yet. When EMAs are in this configuration, traders refer to it as a “death cross,” and rallies tend to get sold into.
The 50-day EMA has marked a solid resistance since the death cross appeared late last year.
The Average Directional Index, or ADX, is at 12.8—well below the 25 threshold that signals a real trend is forming. ADX measures trend strength regardless of direction. Below 20 means the market is choppy and directionless. The bears are in control on paper, but the trend hasn't gone full force yet as can be seen by the sideways movement after the big drop in February.
For Bitcoin bulls, the good news is that a low ADX could point to a trend reversal. The bad news is it needs confirmation from other indicators, and that’s not happening right now.
The Relative Strength Index, or RSI, sits at 47.9—firmly neutral but slightly oversold. RSI measures buying and selling momentum; at this level, neither camp has the edge. Meanwhile, the Squeeze Momentum Indicator shows that compressed energy is building, and the current lean is negative. A squeeze release with downward momentum is a bearish setup.
Moon or doom?
The charts show Bitcoin is more likely to go down. Three identical yellow patterns. Three failed recoveries. $BTC formed a lower high every single time, then broke through support and found a new floor. The descending blue trendline connecting the highs is still intact. The Ichimoku cloud above is deep red—a ceiling, not a floor.
Close below $65,000, and it's a major confirmation for this pattern. The path to $55,000 then opens with little structural support in between.
On Myriad, traders are leaning that way too: traders say there’s a 57% chance $BTC’s next major move is a dump to $55,000, compared to 43% odds on a pump to $84,000. A separate market asks whether there’s still a chance crypto will bloom this spring: 66% say no, with the market closing May 31.
There's a real argument for the other side. Bitcoin is down more than 45% from the $126K all-time high set last October. Some analysts—including Main Management's Kim Arthur—have called this the "bottoming phase" of a classic four-year crypto winter.
But bulls need to see real confirmation first: Bitcoin breaking past the $75,000 mark with conviction, ADX climbing above 20 to signal a genuine trend forming, and the 50-day EMA starting to curl back toward the 200-day. None of that is happening yet. Without it, any bounce seems like just another lower high in the making.
Disclaimer
The views and opinions expressed by the author are for informational purposes only and do not constitute financial, investment, or other advice.