
Bitcoin is holding above short term support, but the next move still looks fragile as two charts point to levels that could decide direction. One setup keeps focus on $68,055 for upside momentum, while the other shows why traders are watching the 50 day SMA and the CME gap near $67,000.
Bitcoin Holds $68,055 Micro Support After Fib Extension Reaction
Bitcoin is testing a key short term support level near $68,055 after reacting at the 100% Fibonacci extension, according to a chart shared by Man of Bitcoin. The analyst said that holding this level would keep near term upside momentum intact, while a break below could signal the start of a weaker corrective path.
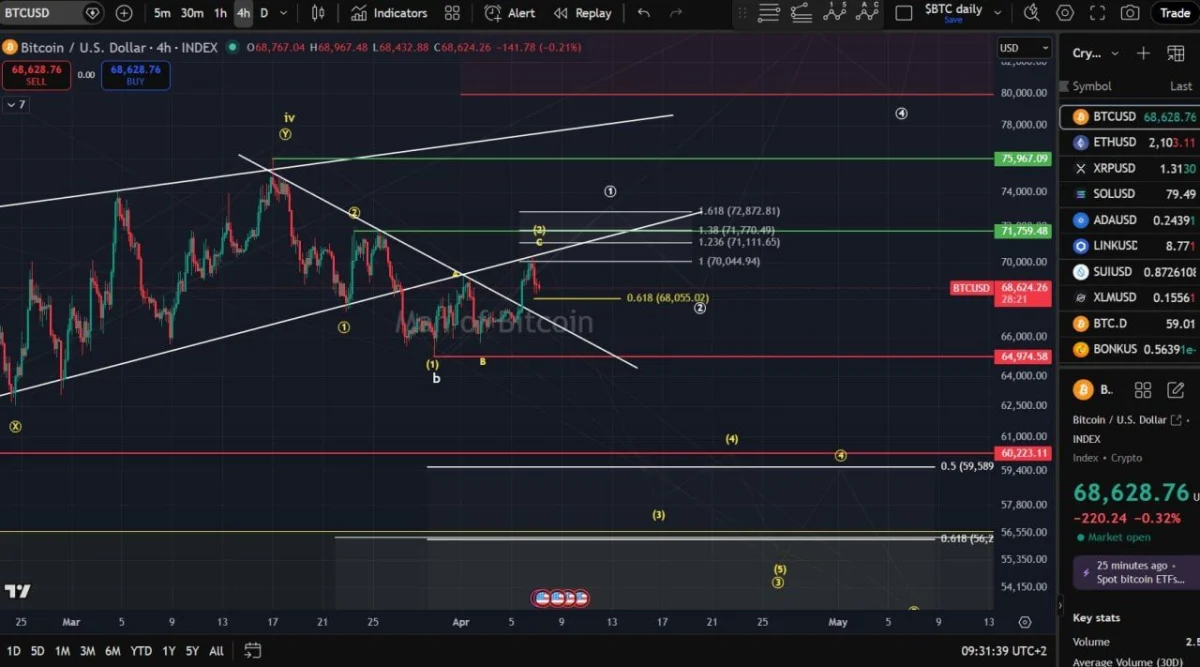
Bitcoin 4H Chart. Source: Man of Bitcoin
The four hour chart shows Bitcoin pulling back after reaching resistance near the recent extension target. At the same time, price remains above the marked micro support zone, which now stands out as the first level traders may watch. As long as that area holds, the chart suggests Bitcoin could preserve its short term bullish structure.
Above the market, the chart marks several possible upside levels. The nearest projected resistance zones appear around $70,044, $71,111, $71,759, and $72,872. In other words, if buyers defend support and regain momentum, Bitcoin may attempt another push into that higher resistance cluster.
However, the chart also outlines a bearish alternative. If Bitcoin falls below $68,055, Man of Bitcoin said that would be the first sign the yellow roadmap scenario is beginning to develop. That projected path points to a deeper move lower, with downside levels shown near $64,974, $60,223, and the mid $50,000 area.
So far, the support has not failed, and the structure remains undecided. Therefore, Bitcoin’s next move around $68,055 may determine whether the market resumes its upward trend or shifts toward a broader pullback.
Bitcoin Holds Above 50 Day SMA as Traders Watch $67K CME Gap
Bitcoin remains in a constructive position on the daily chart as long as it continues to close above the 50 day simple moving average and stays above the broken 2026 downtrend line, according to a chart shared by SuperBro. The setup suggests the market is trying to hold a recent technical improvement after weeks of pressure beneath descending resistance.
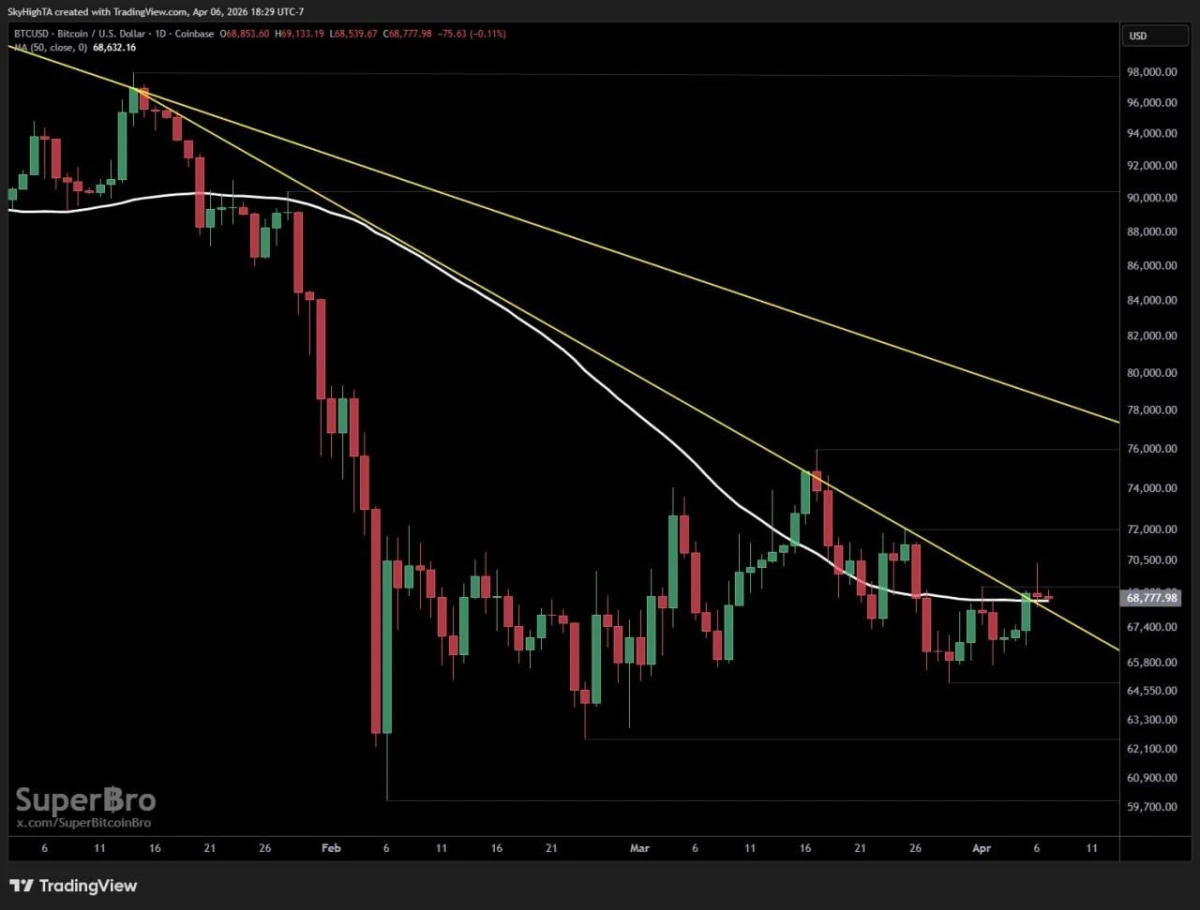
Bitcoin Daily Chart. Source: SuperBro
The chart shows Bitcoin pushing above the falling trendline that had capped price action for months. At the same time, it is holding near the 50 SMA, which now acts as an important support area. In other words, buyers are still defending a structure that could keep the short term recovery intact.
That said, the chart also highlights a key risk below. SuperBro pointed to a CME gap near $67,000, a level many traders often monitor as a possible magnet during pullbacks. If Bitcoin slips lower, that zone may become the first area to watch for a possible revisit.
For now, the daily structure remains stable. Bitcoin has broken the downtrend and is holding above its moving average, which keeps the chart in relatively good shape. However, a move back below those levels could weaken the setup and shift focus toward the open gap near $67,000.