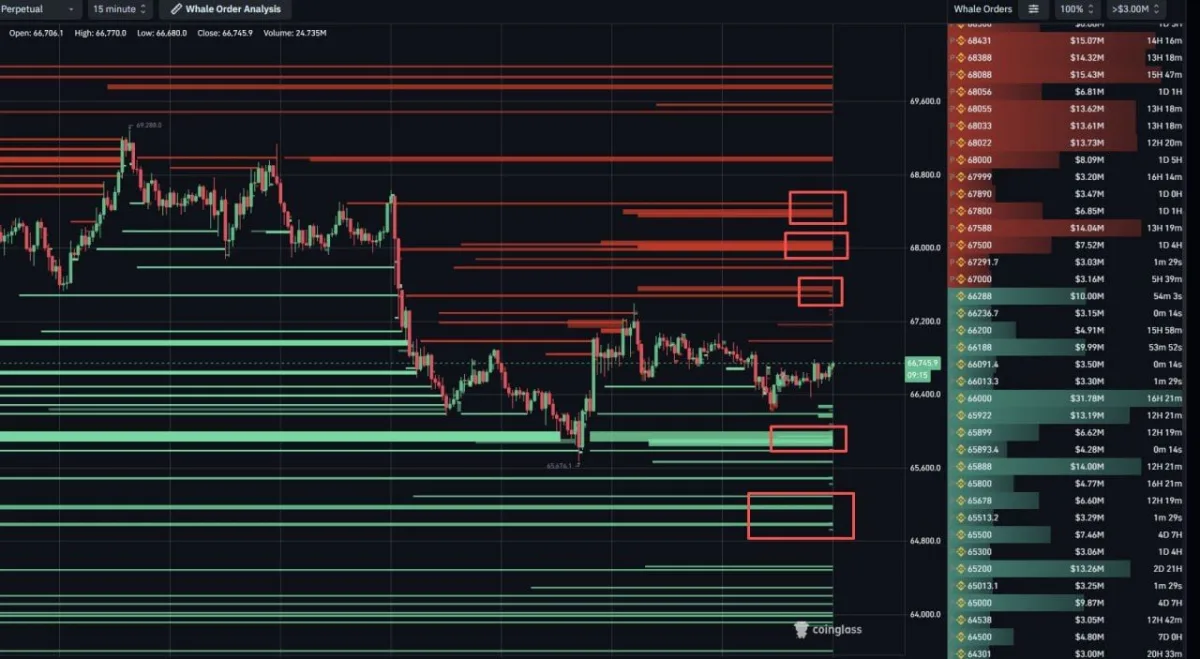
$BTC Whale Orderbook Update: Source: CoinGlass
Moreover, the chart supported a short term range bound view, not a trend setup. Price stayed near the middle of the band after a sharp drop, then moved sideways as buyers and sellers held their levels. The upper red bands marked heavy resistance, while the lower green zones showed where buyers could step in. Because neither side broke decisively, Bitcoin remained compressed inside this whale defined structure.
Therefore, the next move depends on whether those large orders hold or disappear. A bullish shift would likely require buyers to absorb the sell walls near $67,500 and the $67,950 to $68,050 zone. In contrast, a bearish move could follow if support bids around $65,600 to $65,800 get pulled or fail to absorb selling pressure. Until then, the setup points to chop, with whales still controlling the range.
Bitcoin Returns to Midline as Log Regression Model Signals Cooling Cycle
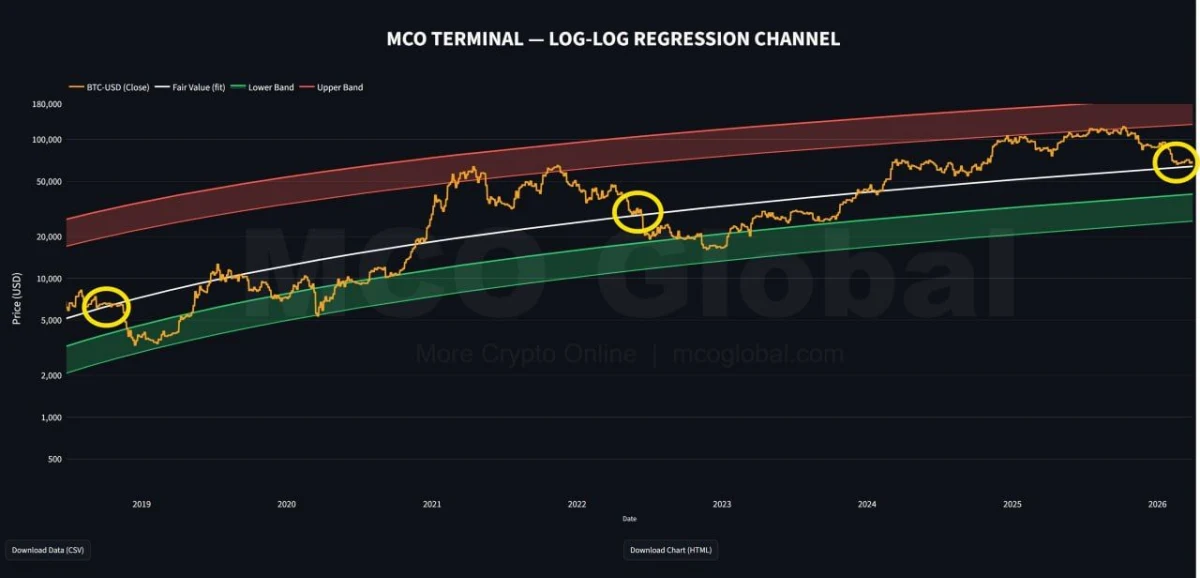
Bitcoin has moved back toward its long term fair value zone after trading in an overheated area earlier in the cycle, according to a log log regression chart shared by More Crypto Online. The model places the midline near $63,000 and shows $BTC now trading close to that level after spending months near the upper band. That shift suggests part of the prior excess has already been cleared from the market.
$BTC Log Log Regression Channel. Source: More Crypto Online
The chart tracks Bitcoin inside a long term regression channel, with the white line marking fair value, the red zone showing upper extension, and the green zone marking lower trend support. In September, when $BTC traded near the upper band, the model signaled that price had become stretched. Since then, Bitcoin has corrected and returned to the midline area, which the chart now frames as a normalization phase rather than a fresh breakout.
Moreover, past cycles on the same chart show Bitcoin often consolidating around this midline before its next larger move. However, that next move does not automatically turn bullish. The current setup still leaves room for further downside, especially if $BTC fails to show strong follow through from the fair value zone. As a result, the model does not suggest the correction is over. Instead, it shows that the market has cooled from extreme levels and is now testing a key trend area.

 coinpaper.com