cryptopotato.com
Bitcoin is closing out Q1 2026 on a sour note. The largest crypto is trading around $66.4k after a quarter that saw shedding nearly half its value from the October 2025 peak near $125k. With macro and geopolitical uncertainty still weighing on risk assets and no major structural level reclaimed, $BTC heads into Q2 without a clear bullish catalyst on the horizon.
Bitcoin Price Analysis: The Daily Chart
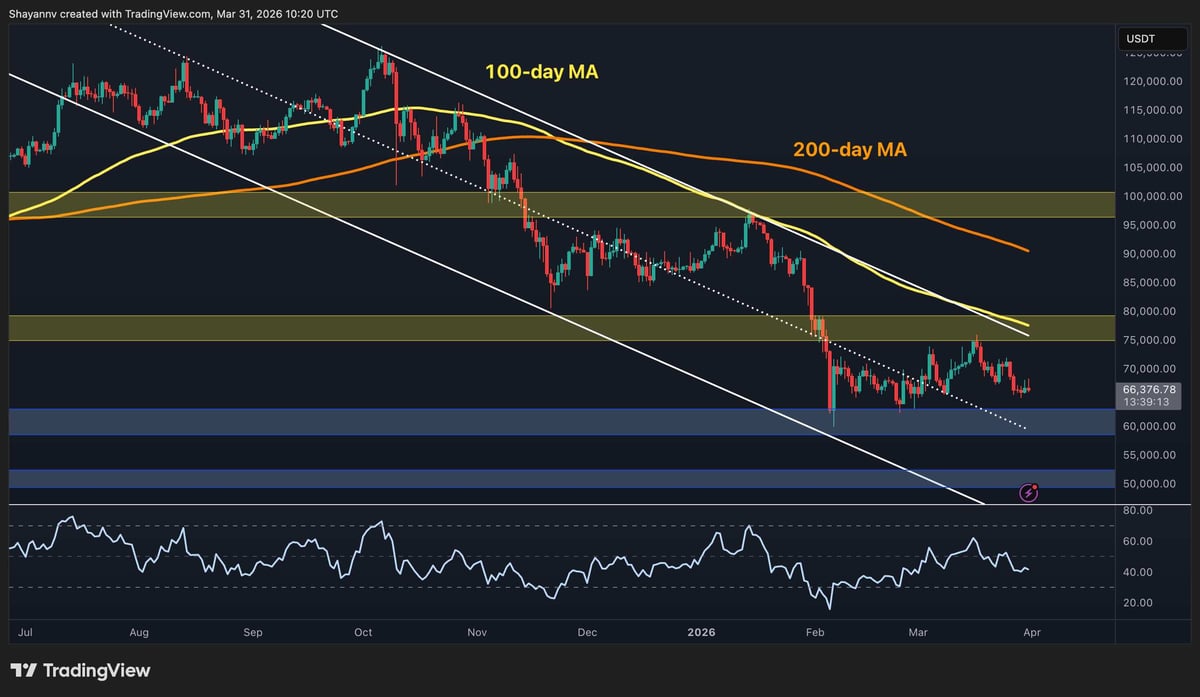
On the daily timeframe, it is evident that the descending channel that has governed Bitcoin’s price action since late 2025 remains intact. Both the 100-day MA (~$77k) and 200-day MA (~$90k) are declining above the current price. The $75k–$80k zone, which served as a key support base earlier, has since flipped to resistance and rejected every recovery attempt in March.
Immediate support sits at the $60k band, which held during the February capitulation drop. A breakdown below that level on a closing basis would expose $BTC to the $50k zone. Meanwhile, the RSI is hovering around 40, which reflects a market that is stabilizing but far from turning around. Therefore, a decisive daily close above $75k remains the minimum requirement for any credible shift in the broader trend.